Microsoft previews unified query monitor for Fabric Data Warehouse
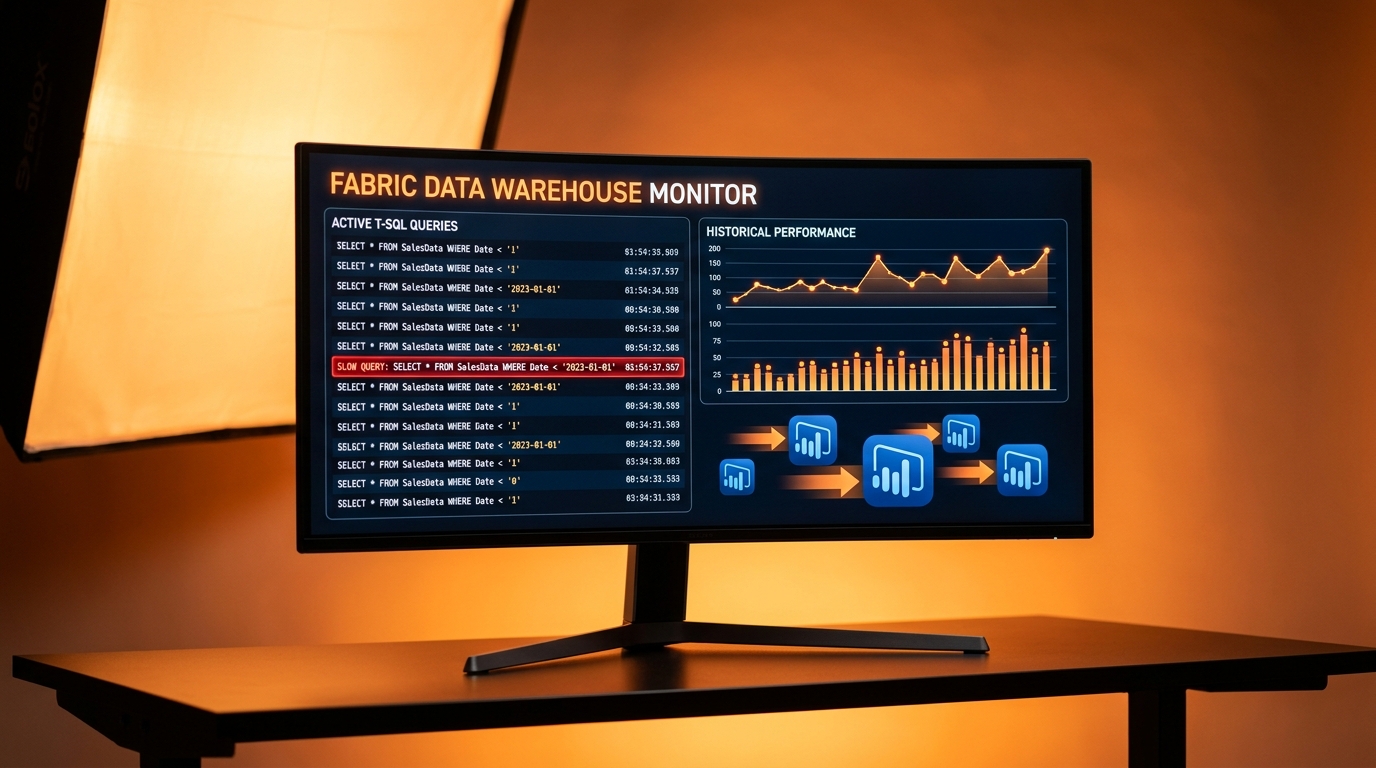
Microsoft has released a preview of Data Warehouse Monitor in Fabric. The tool pulls active and historical T-SQL queries into one interface for easier oversight. It lets users analyse performance trends across runs, spot slow patterns, and cancel hung queries on the spot. This replaces the older Query Activity feature. Access requires workspace admin rights, with historical data lagging up to 15 minutes and results capped at the top 10,000 rows.
Warehouse users previously juggled separate views for live queries and past performance, often missing root causes of slow Fabric refreshes that crippled Power BI reports. The unified monitor now surfaces patterns in one glance, cutting diagnosis time and letting non-experts handle warehouse hiccups without calling IT. For reports fed by Fabric, this means reliable Direct Lake loads instead of hours chasing ghosts in undocumented queries.
Analysis
This hands Excel holdouts a cheat code for Fabric warehouses without the data engineer pretence – skip it only if your reports stay Desktop-bound. Right now, migrate one inherited slow refresher to a Fabric workspace, run the Monitor to axe its worst query, and demo the speedup to your boss.
Pulse published by Collab365 Spaces. Cite as "Microsoft previews unified query monitor for Fabric Data Warehouse", Collab365 Spaces. 2 sources referenced.