A working way to show the rows behind a Power BI measure
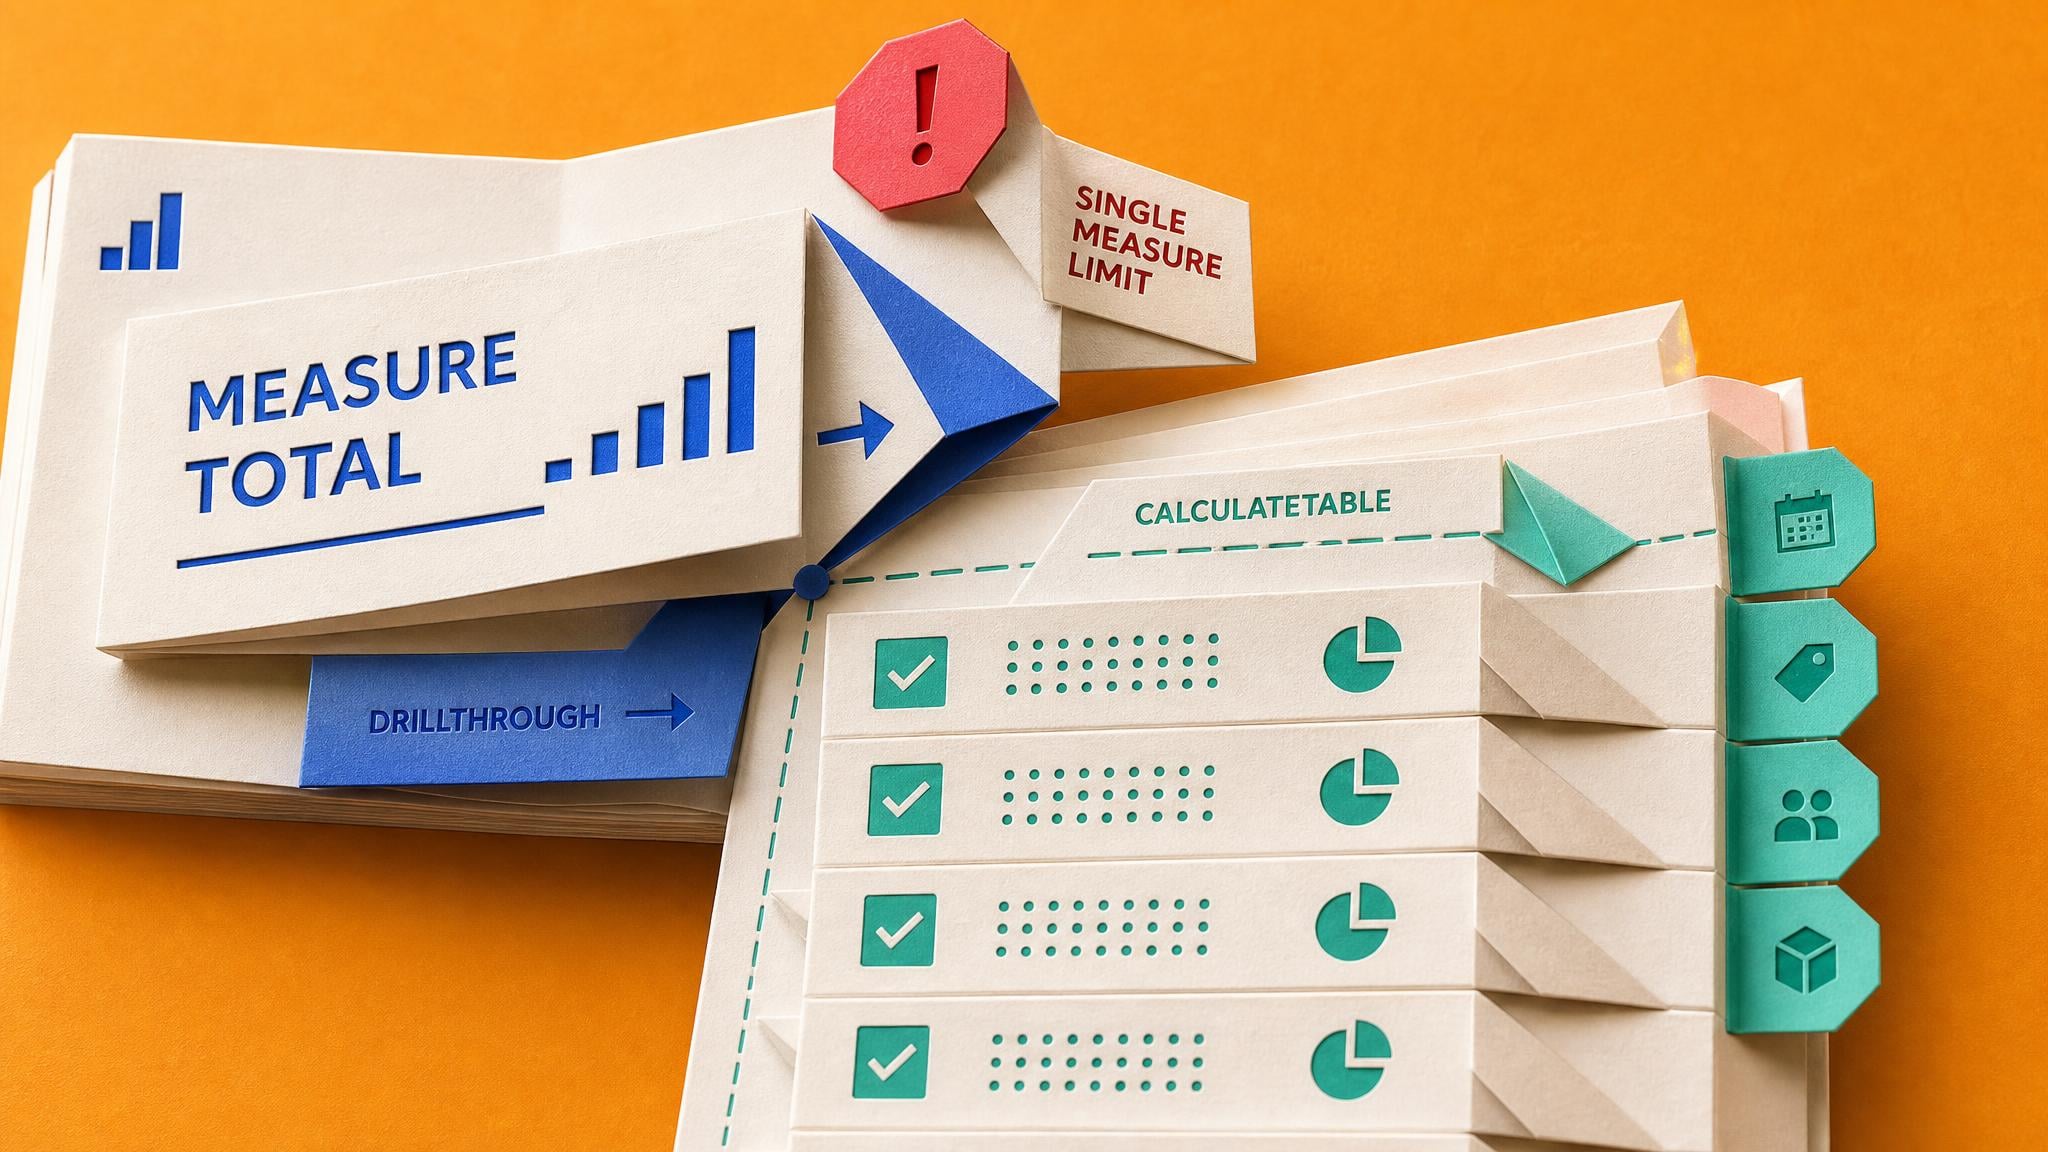
Detail Rows Expressions let whoever builds the model define exactly which rows sit behind a measure, so "show me the detail" returns the modeller's answer rather than a second query that guesses. Until now that output only appeared in Excel PivotTables. On 16 August 2026 Chris Webb published a working pattern that puts it inside a Power BI report: build a paginated report with datasets for the dimensions, add one using EVALUATEDETAILROWS with CALCULATETABLE and RSCustomDaxFilter so multi-value parameters work, then drop a Paginated Report visual onto a drillthrough page and map the dimension columns as parameters. He is direct about the limit: it is hard-coded to a single measure, because nothing tells the report which measure the user clicked on. Calculation groups or a measures table are his suggested routes if you need more.
"Where does this number come from?" is the question that quietly decides whether a dashboard gets used or exported back into Excel. The usual answer is a details page showing a raw table, which is almost never the same set of rows the measure actually used — the filters differ, the grain differs, and the totals do not tie. That gap is where trust goes, and it is why so many stakeholders keep a spreadsheet next to your report. This pattern closes the gap by making the drill-through show the definition rather than an approximation. It is honest plumbing, not a feature: you maintain a paginated report alongside the model, you need somewhere that can host paginated reports, and the one-measure ceiling means you cannot roll it out everywhere. That is fine. The measure that generates the "can you check this figure" emails is usually one specific number, and fixing that one is worth more than a general capability nobody uses.
Analysis
Pick the single measure people question most, check your workspace can host a paginated report before you plan anything, then wire one drillthrough page to it and see whether the follow-up emails stop.
Source note
Pulse published by Collab365 Spaces, reviewed by Collab365 editorial team on . Cite as "A working way to show the rows behind a Power BI measure", Collab365 Spaces.