Official outcome
Power BI Success Path
A guided Power BI learning path that takes learners from their first practical report through stronger setup habits, applied skill-building, and reliable data model foundations.
5 core steps
Explore this Board The month starts the same way: exports from three systems, a paste into the master sheet, and a quiet compare against last month because one stakeholder will notice if a total moves. Your manager asks when Power BI will replace the pack. The same week, someone exports the dashboard back to Excel because they do not trust it. You were never supposed to be a data engineer. You were good with Excel, and the reporting job found you. What nobody handed over was the workflow: clean data, agreed KPIs, a model you can explain, a refresh that does not need rescuing. Microsoft 365 Report Builders is built around exactly that: which tool fits which reporting job, Power Query cleanup habits, KPI definitions that end the arguments, refresh and gateway diagnostics, and honest guidance on Fabric and Copilot. Reports people trust. Numbers you can defend.
Yours for good. One payment, lifetime access to everything in this Space, including every Board built on it. No subscription.
Rather try first? Start a free trial, or subscribe from $49/mo for every Space.
By Collab365: helping professionals keep up since 2015 · rated 4.5 “Excellent” on Trustpilot
187 members· 9 joined in the last 7 days
Buying for your team? Explore Team Boards
Sound familiar?
Before this Space
With this Space
Why this matters now
Every month the pack ships by hand is another month the numbers rest on one fragile spreadsheet and one person's memory, while Fabric and Copilot keep moving the ground underneath.
Why this Space exists
Start with the skill you want to learn or the problem you want to work on. Courses explain the subject, Blueprints guide practical work, and short Briefings help with the decisions along the way.
Explore the skills and recurring problems relevant to this area of work.
Use explanations, examples and checks to make your own decisions with more confidence.
Study a course in depth, follow a practical Blueprint or use a Briefing for a focused explanation.
Your path inside
Work through the modules in order, or open the syllabus and jump to the specific friction you need to solve today.

Excel-strong analysts inherit Power BI reports and must change them without breaking refresh or stakeholder trust. This course shows how to create a safe working copy, fill an audit workbook, inspect sources and measures, classify risk, make one reversible change, and produce a…
Explore this course
Discover why Power BI beats Excel for dashboards and reports — six practical reasons that will change how you think about data.

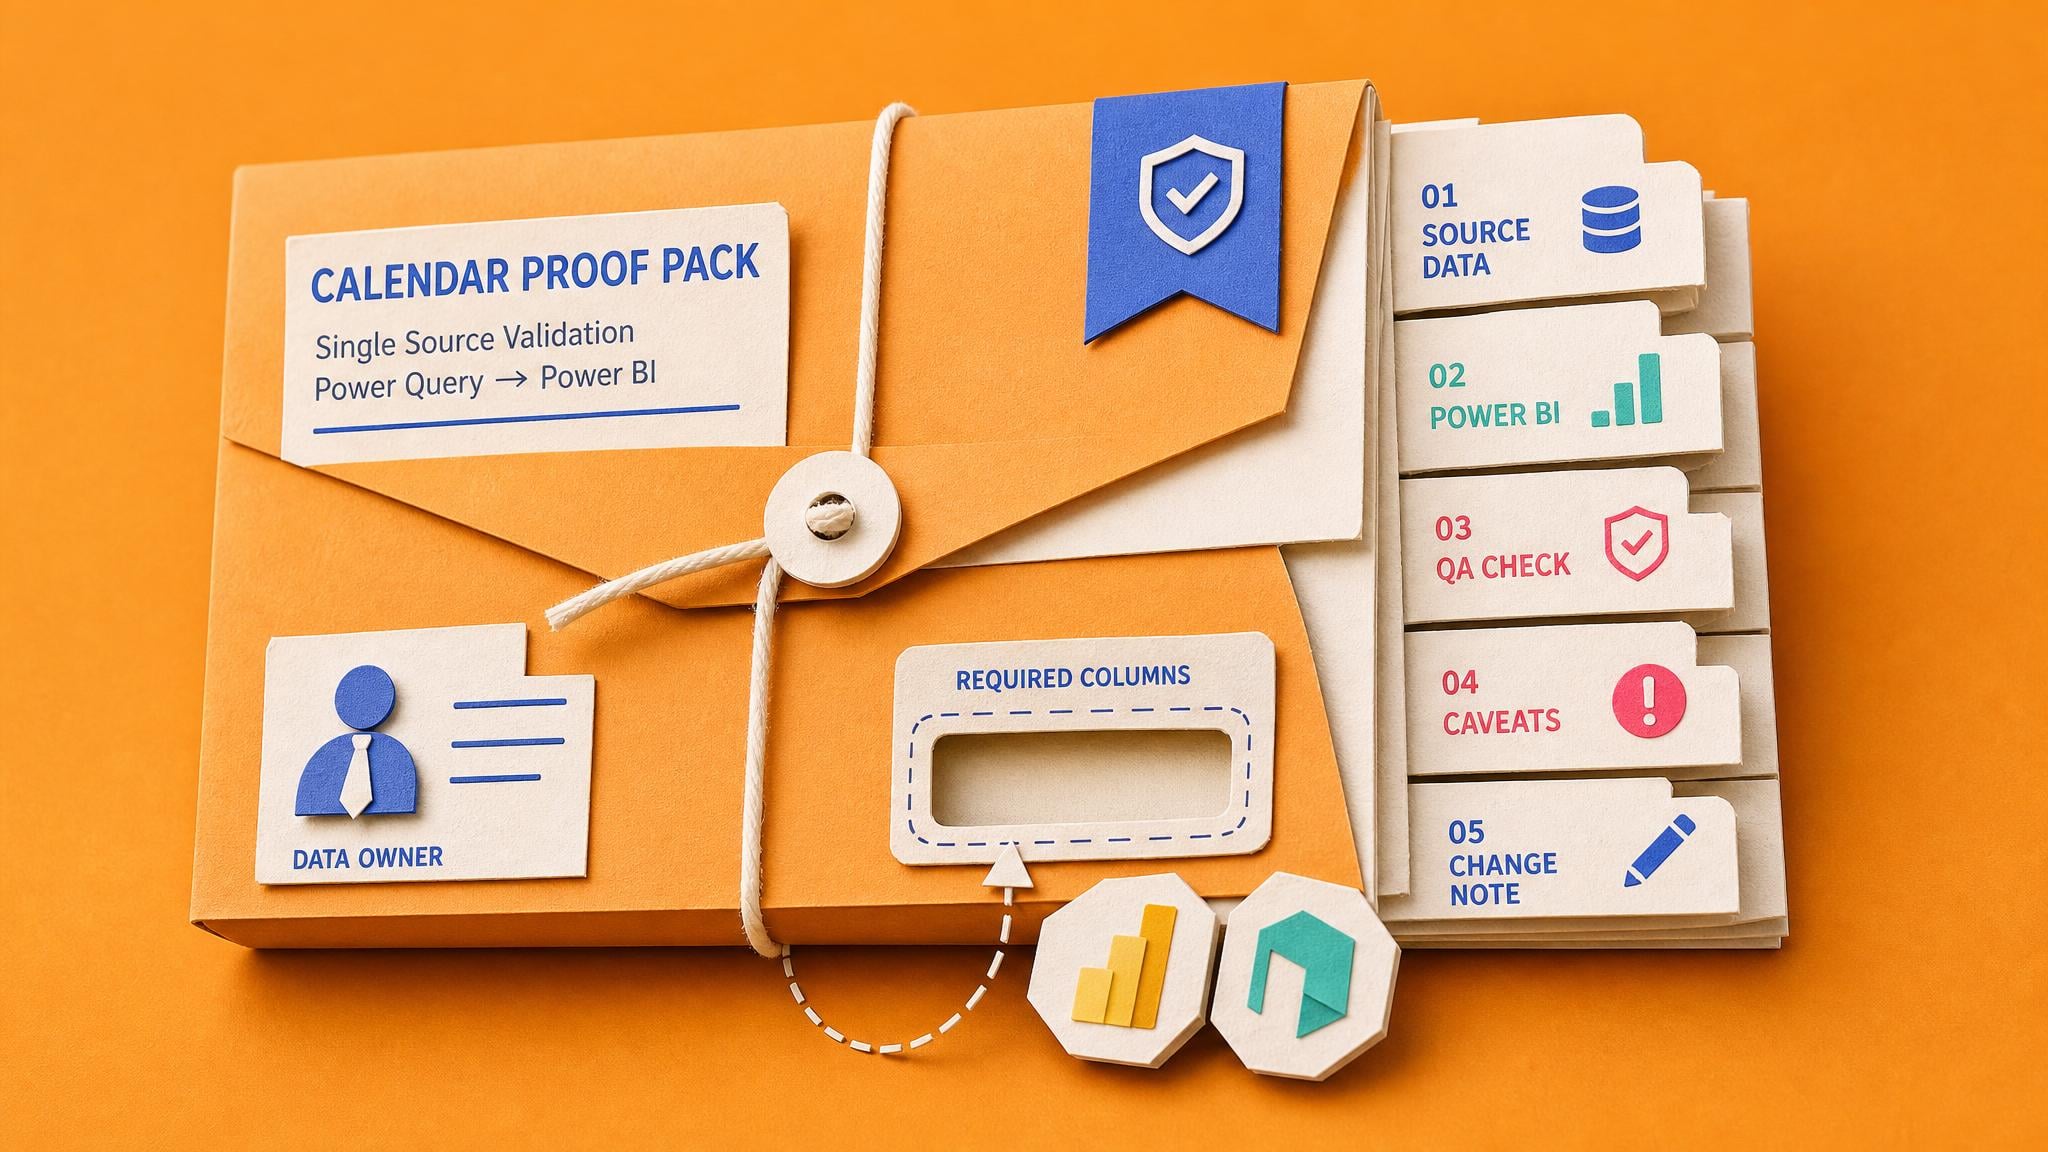
Weekly Excel reports break when source files change or owners leave. This course maps the hidden routine, adds Power Query refresh, QA checks, version control, and a handover pack so the report survives staff changes.

Power BI dashboards that users export to Excel signal missing decisions, drill paths, detail, or working surface. This course shows how to read usage metrics, study an exported Excel file, run two short user conversations, write a dashboard brief, ship one fit fix, and compare…

DAX turns Power BI from charting into serious analytics. This intermediate path covers filter context, measures, percentages, and date intelligence so analysts write calculations with genuine understanding instead of copied formulas.

Focused Power BI skill-building on data models from multiple sources, SharePoint folder imports, and Power Query transformations. Standalone intermediate sessions for filling gaps in modelling and data cleansing.

Beginners build a complete Power BI report from scratch with Olympics sample data. Covers Desktop install, import and transform, line graphs, gauges, slicers, pie charts, tables, cards, theming, mobile layout, and publishing to the service.

Power BI microcourse teaches absolute beginners the fundamentals through nine lessons. Learners explore the ecosystem, create a report in three steps, develop visualisation skills, get an overview of DAX, and share insights.

Intermediate Power BI path from single-table reports to multi-source models, relationships, drill-through, DAX basics, app publishing, scheduled refresh, cloud reports, and row-level security for controlled access.

Finance and operations reporting leads migrate one month-end Excel pack slice to Power BI. Inventory hidden rules, run old and new in parallel, log every variance, and obtain stakeholder sign-off before any cutover.

Data models underpin every reliable Power BI report. This course covers relationships between tables, data cleansing and profiling, cardinality rules, hierarchies, date tables, and basic DAX measures.

Analysts merge recurring Excel exports that change without notice. This course shows how to create one reusable Power Query workflow with source inventory, target columns, folder filters, column-drift checks, error rows, exception log, recovery path, and refresh checklist.
Guided Boards
Follow a clear route to a specific result. See the steps, tool requirements and access included with each Board before choosing.
Official outcome
A guided Power BI learning path that takes learners from their first practical report through stronger setup habits, applied skill-building, and reliable data model foundations.
Explore what is inside
Explore the courses and practical resources available in this Space. Choose what fits your work, then go deeper when you need to.
Published examples from this Space
A read-only rail of recent member-safe cards: blockers, briefings, courses, blueprints, and Pulse updates.
Research-to-solution example
The carousel shows the breadth. This route shows how one researched blocker turns into briefing-level context, guided practice, and a reusable blueprint.
Example depth
One complete route from 9 mapped blockers.
Source to solution
One blocker becomes practical help in three formats.
Blocker
Start with the problem
Leadership mandates moving the month-end Excel reporting pack to Power BI. The pack contains linked workbooks, manual adjustments, and stakeholder-memorised numbers. Without a parallel-run plan and reconciliation process, any variance lands on the reporting owner.
Briefing
From blocker2Understand the best answer
Walk into the migration conversation with a defensible split instead of a stall
Course
From blocker3Work through the path
One pack slice migrated, reconciled against the signed-off numbers, and cut over with stakeholder agreement
Blueprint
From blocker4Leave with an asset
The whole migration, its evidence, and its approvals live in one inspectable workbook
Vault archive included. Videos, workshops, recordings, and saved resources sit behind the new Space content.
New tool changes, member questions, and report-building problems are reviewed, scheduled, and turned into practical help after you join.
Sept
15
Tue
Excel-strong reporting owners face broken refresh, disputed KPIs, and manual cleanup across Power BI, Power Query, and Fabric. Matching the failure to the bottleneck—not the product menu—avoids wasted license spend. A Report Tool Decision Record clarifies ownership and next…
Sept
15
Tue
Accidental BI owners maintain critical monthly reports in undocumented Excel files. Each new Microsoft tool announcement triggers more training spend without fixing fragile formulas and hidden steps. Reports stay broken because implicit logic is never extracted first.
How it stays useful
Tools change. Tactics date. Spaces keeps scanning for the role-specific signals that matter, then packages them as briefings, courses, and practical assets.
New sources, tool updates, and member signals are reviewed for relevance.
The useful findings are checked before they become guidance.
Courses, briefings, and playbooks stay tied to the work you actually do.

Space level
Raise new blockers
Item level
Discuss the exact answer
Member-led signal
Spaces are not just a read-only library. Members can add the blockers they are facing, ask follow-up questions, and discuss the work at Space level or directly beside the blocker, briefing, course, blueprint, or Pulse update that sparked it.
Capture the real problem, including the messy context a generic search misses.
Keep the conversation tied to the Space or the exact piece of content.
Useful patterns become research, briefings, courses, and blueprints.
Before you decide
You choose a plan or simply stop. Nothing is charged during the trial and no card was taken, so there is nothing to cancel. Plans start from $49/mo.
No. The trial asks for an email, not a card.
Your trial covers up to 2 Spaces. Choose the ones most relevant to your work before deciding what to keep.
It is self-paced. Inspect a course syllabus or Board, choose one that fits your task, and work through it at your pace. Not every problem already has a solution here. You can suggest a recurring problem for us to consider researching; this is not an immediate bespoke service.
No. It runs on the Problems-First Method: blockers are researched first, then answered in the right format for the job, whether that is a briefing, a course, or a reusable blueprint.
Yes. Plans renew automatically and you can stop the renewal whenever you like from your account.
Pick the courses, briefings, blueprints, and Pulse updates your team needs from Microsoft 365 Report Builders. Add useful content from other Spaces too, then share one focused board and track progress in Team Admin.
Choose a course or practical project that fits your work, and come back as your skills and needs grow.
Yours for good. One payment, lifetime access to everything in this Space, including every Board built on it. No subscription.
Rather try first? Start a free trial, or subscribe from $49/mo for every Space.
By Collab365: helping professionals keep up since 2015 · rated 4.5 “Excellent” on Trustpilot
Already a member? Sign in