1. What's Changed Since This Session
The landscape of Microsoft data tools has fundamentally shifted since the original 2021 workshop. You saw a workflow that relied heavily on standalone Power BI Pro architecture and manual data modeling techniques. Today, the ecosystem is deeply integrated into Microsoft Fabric and heavily augmented by generative AI and Copilot agents.
The original session utilized features that have either been fully deprecated or vastly superseded by modern alternatives. The following table summarizes the core technological shifts and their current status as of March 2026.
| Technology | Status in 2026 | What Replaced It / Updated To |
|---|---|---|
| Power BI Desktop | Actively updated | Latest version features deep Fabric integration, the new Model Explorer, DAX Query View, and native Copilot interfaces. |
| Office 365 Tenant Setup | Evolved | Microsoft 365 Business configurations now integrate tightly with Power Platform Developer plans and Fabric tenant structures. |
| SharePoint Lists | Actively updated | Modern SharePoint emphasizes metadata columns over folders and features enhanced Power Query site picker integration. |
| Power BI Workspaces | Evolved | Workspaces are now Microsoft Fabric Workspaces. They must be assigned to specific Fabric capacities (e.g., Trial, F64) to utilize premium compute. |
| Old Excel/CSV Import (Service) | Deprecated | The legacy import experience in the Power BI Service has been deprecated. It is replaced by Fabric Dataflows and OneLake integrations. |
| Data Modeling Interface | Evolved | The Model Explorer UI now handles Calculation Groups, Perspectives, and semantic model properties directly. |
| Time Intelligence | Replaced | Auto-date/time and Classic DAX functions are being replaced by the highly flexible Calendar-based Time Intelligence (Preview). |
| DAX Measure Creation | Evolved | DAX Query View allows for bulk evaluation and testing. Calculation Groups eliminate the need for redundant measure creation. |
| Power BI Q&A Visual | Deprecated | Q&A was deprecated in late 2026 and fully replaced by the more advanced, conversational Copilot in Power BI. |
| Power BI Premium (P-SKUs) | Replaced | P-SKUs are largely legacy transition items. They are replaced by Microsoft Fabric Capacities (F-SKUs). |
| Default File Format | Evolved | The PBIR (Power BI Report) format has become the standard default, replacing older saving conventions. |
| Report Distribution | Evolved | Direct report sharing is discouraged. Organizational Apps with persistent filters and App Copilot are the standard. |
The Evolution to Microsoft Fabric
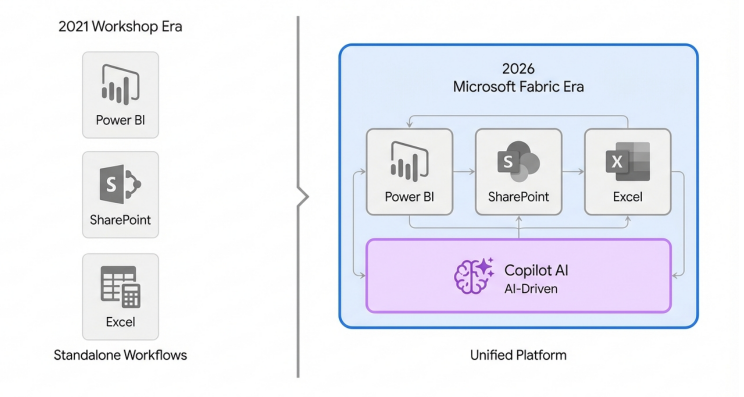
The transition from standalone Power BI workflows to the unified Microsoft Fabric architecture
2. How to Build This Today
This section reconstructs the original workshop using modern enterprise architectures. Every scenario from the recorded session has been systematically updated to reflect the March 2026 reality of Microsoft Fabric. You will find detailed guidance on Copilot integrations, advanced Power BI Desktop features, and updated deployment methodologies.
Demo 1: Installing Prerequisites
The session showed Nick installing Power BI Desktop and setting up an Office 365 tenant trial with a SharePoint site. Here is how you would build that same foundational environment in March 2026.
The modern starting point is no longer just a standalone Office 365 tenant. The ecosystem now requires a Microsoft Fabric trial to unlock the full potential of modern data engineering, OneLake storage, and premium reporting features.
Quick Win: Use the Microsoft Fabric 60-Day Trial. This instantly provisions an F64 capacity environment, allowing you to explore all premium workloads without any upfront licensing costs.
Step 1: Secure the Identity Tenant The primary method for securing a development environment involves the Microsoft 365 Business trials. You must navigate to the official Microsoft 365 Business plans page. Select the free trial option for a Business Basic or Business Standard plan.
Follow the guided setup to create a new domain configuration. This provisions the foundational Entra ID (formerly Azure AD) tenant necessary for identity management and authenticating your subsequent data connections.
Step 2: Activate the Fabric Trial Capacity
Once the underlying Microsoft 365 tenant is active, navigate directly to app.fabric.microsoft.com. Look at the upper-right corner of the Fabric homepage and select the profile photo icon to open the Account Manager.
Select the Start trial button from the dropdown menu. A prompt will appear asking you to activate the 60-day free Fabric trial.
Review the trial capacity regions and select your preferred home region. Click Activate. This action automatically provisions an F64 capacity tier, granting 1 TB of OneLake storage and unlocking workloads like Data Factory and Synapse Data Engineering.
Step 3: Provision the Modern SharePoint Site The original session used SharePoint as a raw data repository. Modern SharePoint relies heavily on metadata structures rather than legacy, messy folder hierarchies.
Navigate to the SharePoint start page via the Microsoft 365 app launcher. Select + Create site. Choose a Communication site if your goal is broad organizational reporting, or a Team site for secure, granular collaboration.
Enter a formal site name, ensuring the site address contains only allowed symbols like underscores and dashes. Click Finish to deploy the modern site architecture.
Step 4: Create the Metadata-Driven Document Library Avoid using standard folders for your data sources. Select New > Document library from the SharePoint site home page. Name the library "Raw Data Sources".
Select the gear icon and explicitly add custom metadata columns to this library. This best practice ensures that when Power BI connects to the SharePoint folder, the data files are easily filterable by business department, fiscal year, or data type without relying on fragile file path names.
Demo 2: Setting up a Power BI Workspace and Accessing Shared Resources
The session showed Nick setting up a standard Power BI workspace and accessing shared resources, including a slide deck and two Excel files. Here is how you would build that same collaborative structure in March 2026.
Workspaces are no longer just simple folders for Power BI reports. They are comprehensive, collaborative environments that host Data Factories, Synapse Notebooks, and interconnected OneLake components.
Quick Win: Assign your new workspace immediately to the Fabric Trial capacity. This ensures all your semantic models and reports benefit from premium compute power and advanced features.
Step 1: Create the Fabric Workspace
Navigate to the Fabric portal at app.fabric.microsoft.com. In the left navigation pane, select Workspaces, then click + New workspace.
Provide a clear, descriptive name following modern naming conventions. For example, use a prefix like Finance_Analytics_Dev to establish clear governance.
Step 2: Assign the Workspace to Capacity This is a critical modern configuration step. Once the workspace is created, open the workspace and select Workspace settings from the top menu. Navigate directly to the Workspace type tab.
Select Fabric Trial (or your designated Premium capacity if fully licensed). Click Apply to confirm the change. A diamond icon will immediately appear next to the workspace name, confirming it is backed by premium compute resources.
Step 3: Upload Shared Resources to SharePoint The original workshop provided Excel files for local connection. In the modern cloud workflow, these files should never live on a local C: drive.
Navigate to the "Raw Data Sources" SharePoint document library you created in the previous demo. Drag and drop the provided Excel files (DirectConnect.xlsx and SharePointImport.xlsx) into the library interface.
Assign the appropriate metadata tags to these files based on your custom columns. This ensures seamless and robust integration with Power Query online later in the development lifecycle.
Step 4: Configure Workspace Security and Governance Security is now handled via strict role-based access control within the Fabric environment. Open Workspace settings and navigate to the Access pane.
Assign roles strictly according to the principle of least privilege. Assign the Admin role only to lead platform developers. Assign the Contributor or Member role to standard report developers. You must assign the Viewer role to end-users who only need to consume the final reports.
Demo 3: Connecting to Data
The session showed Nick connecting to data directly from an Excel file and importing an Excel file into a SharePoint list, then connecting to it. Here is how you would build that same data connection sequence in March 2026.
The data connection experience has been drastically improved with AI integration and streamlined UI elements. The old Excel and CSV import experiences in the Power BI Service have been officially deprecated. All formal connections should be established via Power BI Desktop or Power Query Online.
Warning: Never use the full browser URL when connecting to a SharePoint source. You must always use the root SharePoint address (e.g., https://contoso.sharepoint.com/teams/Analytics/) to prevent connector failures.
Step 1: Connect to the SharePoint List Open the latest version of Power BI Desktop. The modern interface features an updated, more intuitive ribbon. Navigate to Home > Get data > More... to open the connector gallery.
Search for and select the SharePoint List connector. The 2026 update introduces a highly requested and efficient feature: the SharePoint site picker.
Instead of hunting for and manually pasting URLs, use the new dropdown menu. You can select directly from Recent sites or Favorite sites. If the required site is not immediately listed, use the Quick Search box embedded within the picker to locate it.
Step 2: Authenticate the Connection Upon selecting the target site, an authentication window will appear. You must select Microsoft Account and sign in with your Entra ID credentials. Note that Anonymous or Windows authentication protocols will fail for modern cloud-based SharePoint environments.
Once authenticated, the Navigator window opens. Browse the directory tree and select the specific SharePoint list holding your imported Excel data.
Step 3: Utilize Copilot for Discovery If the data source is vast or unfamiliar, the modern developer relies on Copilot integration. The Ask Learn chat experience is now embedded directly in the connector documentation and UI to guide you through complex authentication issues.
Furthermore, the standalone Copilot can summarize the underlying semantic model instantly. Tell Copilot what your end analytical goal is, and it will intelligently suggest which specific tables you need to load.
Select Transform Data to push the selected tables into the Power Query Editor. Do not select Load yet; raw SharePoint data fundamentally requires transformation before it is model-ready.
Demo 4: Cleaning and Transforming Data in Power Query
The session showed Nick cleaning and transforming data manually in Power Query to make it work correctly for reporting. Here is how you would build that same transformation logic in March 2026.
Power Query remains the gold standard for ETL processes, but the 2026 version is significantly augmented by Copilot. Generative AI now writes complex M code, creates AI Data Schemas, and handles intricate transformations entirely via natural language prompts.
Quick Win: Mark your semantic model as "Approved for Copilot" once your transformations are complete. This explicitly prepares the model for downstream AI consumption, allowing Copilot to index the data properly for end-users.
Step 1: Launch Power Query Editor Selecting Transform Data in the previous step automatically opens the Power Query Editor. The interface remains structurally familiar, but the ribbons are now denser with advanced transformation features.
Step 2: Address SharePoint Anomalies SharePoint lists inherently bring in dozens of hidden system columns that bloat the model. Highlight the necessary business columns, right-click the header array, and select Remove Other Columns to optimize performance.
You must address Boolean data inconsistencies immediately. SharePoint often transmits Booleans as unpredictable 1/0 or TRUE/FALSE text strings. Select the boolean column, navigate to the Home ribbon, click the Data Type dropdown, and explicitly force it to Logical/Boolean to prevent calculation errors later.
Step 3: Leverage Copilot for Transformations Locate the Copilot button on the Power Query Home ribbon. Clicking this will open the Copilot interaction pane on the right side of your screen.
Instead of manually writing conditional columns or complex split logic in the M language, use natural language. Type a specific prompt into the box, such as: "Split the 'EmployeeName' column by the comma delimiter, create two new columns named 'LastName' and 'FirstName', and capitalize the first letter of each."
Copilot interprets the intent, generates the exact M code, and automatically applies the transformation step to the query. You simply review the applied step for accuracy and proceed.
Step 4: Prepare Data for AI Schemas A major 2026 requirement is preparing the data specifically for AI consumption. If the underlying data is messy or ambiguous, Copilot will inevitably return hallucinations in the final report.
The process of refining raw data into an AI-ready semantic model is a critical three-stage workflow. First, raw data must be explicitly structured and cleaned within the Copilot Power Query interface. Next, developers must apply AI Data Schemas by renaming every single column to clear, business-friendly terms, completely removing technical jargon like Emp_ID_PK. Finally, this refined structure allows the model to achieve an "Approved for Copilot" status, ensuring accurate downstream Copilot interactions and natural language querying.
Once these AI-focused transformations are complete, click Close & Load on the Home ribbon to bring the pristine data into your Power BI semantic model.
Demo 5: Implementing Time Intelligence
The session showed Nick implementing time intelligence for date-based calculations using traditional auto-date features. Here is how you would build that same time-based logic in March 2026.
The modern update completely deprecates the reliance on Auto-date/time and complex, manual DAX date tables. The recent platform updates introduced Calendar-based Time Intelligence, which provides native, out-of-the-box support for fiscal calendars, retail 4-4-5 models, and non-Gregorian structures.
Quick Win: Disable the Auto-date/time feature immediately. Navigate to File > Options and settings > Options > Current File > Data Load and uncheck "Auto date/time". This instantly reduces model bloat and improves refresh performance.
Step 1: Enable the Preview Feature Calendar-based time intelligence must currently be enabled in the application settings. Navigate to File > Options and settings > Options.
Select Preview features under the Global settings section. Locate and check the box for Enhanced DAX Time Intelligence. Click OK and completely restart Power BI Desktop to apply the engine changes.
Step 2: Mark the Primary Date Table A dedicated Date table is still structurally required for your model. Select your imported Date table in the Data pane. Navigate to the Table tools ribbon and select Mark as date table.
Select the primary date column from the dropdown to validate the table's structure. You must ensure this column contains unique, contiguous dates with no gaps.
Step 3: Configure the Custom Calendar Right-click the validated Date table in the Data or Model view and select Calendar options from the context menu. Alternatively, you can access this via the Table tools ribbon or the Model Explorer pane.
The new Calendar Options configuration screen will appear. Click New calendar to begin defining your organizational time structure.
Step 4: Map Time Attributes Instead of writing complex DAX to shift fiscal years, the developer now maps the columns directly within the UI.
Assign your table columns to specific conceptual categories (e.g., Year, Quarter, Month, Week). For partial time units—like a column that merely says "Q1" instead of the explicit "Q1 2026"—map them alongside the Year unit so the engine derives the full chronological context.
Save the calendar configuration. Standard DAX functions like DATESMTD and SAMEPERIODLASTYEAR will now natively respect your custom fiscal calendar logic without requiring any formula modifications.
Demo 6: Creating Relationships for Data Modeling
The session showed Nick creating relationships between tables for data modeling on the main canvas. Here is how you would build that same relational model in March 2026.
Data modeling has shifted away from the standard canvas view. It is now centralized within the Model Explorer, a comprehensive hub for managing all semantic model metadata, perspectives, and relationships. Furthermore, managing relationships is now executed heavily through the precise Properties pane rather than dragging and dropping lines in messy visual diagrams.
Quick Win: Enable the "Discourage implicit measures" property immediately. This forces all developers to use explicit DAX, ensuring Copilot indexing and calculation groups function correctly.
Step 1: Navigate to Model Explorer Open your active Power BI Desktop file. On the left navigation bar, select the Model view icon.
Look at the Data pane located on the right side of the interface. At the top of the pane, toggle from the default Tables view to the newly introduced Model view. This opens the full Model Explorer hierarchy.
Step 2: Disable Implicit Measures In the Model Explorer tree, select the top-level Semantic model item.
Look at the comprehensive Properties pane displayed below. Toggle the Discourage implicit measures setting to On. This specific action hides the summation symbols next to numeric columns throughout the UI. It successfully prevents novice users from dragging raw data directly into visuals, thereby forcing the creation of explicit, governable measures.
Step 3: Create Relationships via Properties While dragging relational lines between tables on the visual canvas still works, the 2026 enterprise standard dictates using the Properties pane for absolute precision.
Select the Relationships node in the Model Explorer. Select New relationship from the context menu.
The Edit Relationship dialog appears. Select your primary Fact table (e.g., Sales) and your related Dimension table (e.g., Date). Ensure the cardinality is strictly set to Many-to-one (*:1) and the Cross-filter direction is explicitly set to Single. You must avoid bidirectional filtering unless absolutely necessary, as it causes severe performance degradation and ambiguous filtering paths.
Step 4: Validate Relational Paths
Relationships propagate filters deterministically across your model. You must visually and logically ensure there are no ambiguous relationship paths. If role-playing dimensions are required (e.g., comparing Order Date versus Ship Date), create an inactive relationship. You will then trigger this inactive path using the USERELATIONSHIP() DAX function inside a specific measure.
Demo 7: Building Reports and Basic DAX
The session showed Nick building reports with standard visualizations and writing basic DAX measures for interactivity. Here is how you would build that same analytical layer in March 2026.
The report creation process is now highly automated and sandboxed. Report building relies heavily on the standalone Copilot pane. Meanwhile, DAX creation is streamlined through the safe DAX Query View and optimized using Calculation Groups.
Quick Win: Stop writing dozens of repetitive Time Intelligence measures manually. Use Calculation Groups to write the logic exactly once and apply it dynamically to every metric in your model.
Step 1: Write DAX in Query View Do not create measures blindly directly on the report canvas. You must use the new DAX Query View to test your logic safely without impacting the live model.
Click the DAX Query View icon on the left navigation bar. This dedicated IDE acts as a risk-free sandbox environment.
The shift to this modern workflow is significant. DAX Query View provides a comprehensive left-panel IDE for testing EVALUATE statements and viewing results in a grid, acting as a secure sandbox. Simultaneously, the right-panel Model Explorer allows for the hierarchical management of Calculation Groups, completely eliminating the legacy need for redundant, repetitive measure creation across the model.
Write an EVALUATE statement to test a measure's output before committing it. For example, execute: EVALUATE SUMMARIZECOLUMNS('Product'[Category], "Total Sales",). Once the logic is perfected in the results grid, use the UI button to commit the new measure permanently to the semantic model.
Step 2: Implement Calculation Groups Return to the Model view and reopen the Model Explorer. Click the Calculation groups button located in the top ribbon.
Double-click the newly generated Calculation group and rename it to "Time Intelligence". Rename the underlying calculation column to "Show as" to ensure clarity for the end-user.
Create your specific calculation items. Right-click Calculation items in the hierarchy and select New calculation item. Name the first item "Current" and use the exact DAX syntax: Current = SELECTEDMEASURE(). Create a second item named "MTD" with the corresponding DAX: MTD = CALCULATE(SELECTEDMEASURE(), DATESMTD('Date')).
This single programmatic group replaces the need to write separate MTD measures for Revenue, Cost, and Profit. It applies the logic universally across the model.
Step 3: Build Visuals with Copilot Navigate back to the Report view canvas. Ensure the Copilot feature is enabled in your ribbon.
Click the Copilot icon to open the interactive Copilot pane. Select your associated Fabric workspace if prompted by the system.
Type a highly detailed prompt into the pane, taking advantage of the expanded 10,000 character limit. For example: "Create a comprehensive report page showing Total Sales by Region using a bar chart, and a matrix showing sales by product category. Add a modern visual tooltip to the bar chart." Copilot will intelligently generate the entire requested page structure.
Step 4: Configure Modern UI Elements Review the AI-generated visuals for accuracy. Ensure Modern Visual Tooltips are enabled, as they are now Generally Available. These enhanced tooltips include a drill actions footer, allowing users to drill down or through data points directly from the tooltip interface.
Add the newly released Input slicer (Generally Available as of February 2026) to your canvas. This component replaces tedious scrolling mechanics. Users can simply type or paste exact text values into the slicer to filter the report data instantly.
Demo 8: Publishing and Sharing Reports
The session showed Nick publishing and sharing reports via workspaces, with a heavy emphasis on individual Power BI Pro licenses. Here is how you would deploy that same reporting solution in March 2026.
Publishing remains conceptually similar, but the distribution mechanism has shifted entirely. Sharing individual reports is strongly discouraged in modern governance models. The established best practice is distributing content exclusively via Organizational Apps backed by Fabric F-SKU capacities.
Warning: Never share reports directly from a personal workspace (like "My Workspace"). You must always publish to a dedicated departmental workspace before initiating any distribution protocols.
Step 1: Publish to the Fabric Workspace
In Power BI Desktop, verify that your PBIR file is saved. Click Publish on the Home ribbon. Select the Finance_Analytics_Dev workspace you meticulously created in Demo 2.
Ensure the destination workspace is actively assigned to the Fabric Trial (F64) capacity. This capacity assignment is the crucial linchpin for the subsequent sharing steps.
Step 2: Define Workspace Roles
Navigate to the cloud-based Power BI Service at app.powerbi.com. Open the designated workspace.
Do not use the generic share button on the report. Instead, ensure your internal development team has the correct workspace roles assigned. Developers require Pro or PPU licenses to publish and edit content. Assign them the Member or Contributor role to maintain strict governance.
Step 3: Create the Organizational App To distribute the finalized report to your end-users, package it into an official App. Click Create App in the upper-right corner of the workspace interface.
Define the App's formal name, description, and corporate theme. In the Navigation configuration tab, add the newly published report to the App structure.
Step 4: Enable Persistent Filters and App Copilot Ensure the new 2026 Persistent Report Filters setting is enabled. It is typically toggled on by default. This specific feature ensures that when users change slicers or filters, the App accurately remembers their customized view upon their return.
Note that Organizational Apps now prominently feature a conversational App Copilot. End-users can ask the App Copilot complex analytical questions, and it will automatically find the correct report page or summarize the requested data.
Step 5: Distribute to Free Viewers Publish the compiled App. Because the underlying workspace is backed by an F64 Fabric capacity (via your active Trial), you can distribute this App to the entire organizational directory.
End-users do not need a paid Power BI Pro license to view the App content. They only need a standard Microsoft Fabric (Free) license, which is automatically assigned upon their initial login to the portal.
3. Licensing Quick Reference
Licensing models in 2026 have transitioned definitively from the old Pro versus Premium paradigm to a comprehensive, compute-based Microsoft Fabric capacity model. The exact per-user licenses required for your deployment depend entirely on the size of the underlying Fabric capacity (F-SKU) hosting the workspace.
The following table breaks down the precise licenses needed for the recommended 2026 approaches detailed throughout this guide.
| Scenario | Required Creator License | Required Consumer License | Underlying Capacity Needed |
|---|---|---|---|
| Connecting to data and building PBIX files locally | Fabric (Free) | N/A | Local Machine Compute |
| Publishing content to a standard Shared Workspace | Power BI Pro or PPU | Power BI Pro or PPU | Shared Capacity |
| Collaborating on data engineering (Pipelines, Notebooks) | Fabric (Free) | N/A | Fabric Capacity (F2+) |
| Distributing reports via App (Small Organization) | Power BI Pro | Power BI Pro | Shared Capacity or F2-F32 |
| Distributing reports via App (Enterprise Scale) | Power BI Pro | Fabric (Free) | Fabric F64+ or Trial |
| Utilizing Copilot in Power BI Desktop/Service | Power BI Pro | Fabric (Free) / Pro | Fabric F64+ or Trial |
2026 Fabric & Power BI Licensing Matrix
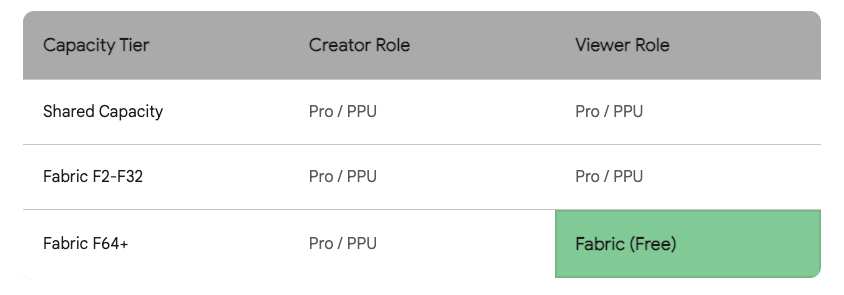
The F64 capacity tier acts as the critical threshold, allowing unlimited Fabric (Free) users to consume published reports.
Data sources: Microsoft Learn (Fabric), Microsoft Learn (Power BI), Medium, Metrica Software
Key 2026 Licensing Rules to Remember:
- The Critical F64 Threshold: The most important architectural rule in modern Fabric licensing is the capacity size limit. If your workspace resides on a capacity smaller than F64 (e.g., F2 to F32), every single user attempting to view the report must have a paid Power BI Pro or PPU license assigned to their account.
- The Free Viewer Right: Once the workspace is successfully upgraded to an F64 capacity (or is utilizing the 60-day Trial environment), the consumption rules change dynamically. Users assigned the "Viewer" role on the workspace or within an App only require a Fabric (Free) license to consume the published content.
- Creators Always Pay: Regardless of the organizational capacity size, the developers actively authoring and publishing reports into the service must always hold a Power BI Pro or PPU license.
- Strict Copilot Requirements: To access any Copilot features in the Power BI Service or Desktop, the organization must be running on a paid Fabric F64+ capacity or P1+ capacity. Furthermore, Copilot functionality is explicitly disabled by default during standard Fabric free trials.
Briefing published by Collab365 Spaces. Cite as "Master Power BI Fundamentals Workshop: 2026 Companion Guide", Collab365 Spaces. 34 sources referenced.