The landscape of data transformation has fundamentally shifted since the original presentation recorded circa 2024. The integration of Microsoft Fabric has evolved standalone Power BI data flows into a comprehensive, enterprise-grade data engineering toolset.
This report provides an exhaustive, expert-level update to the original material. The analysis focuses entirely on the current March 2026 ecosystem, prioritizing new features, AI-driven automation, and modern architectural best practices.
The transition from Power BI Dataflows (Generation 1) to Fabric Dataflow Gen2 represents a complete architectural overhaul. Microsoft has decoupled the transformation engine from the storage layer, allowing organizations to route curated data to diverse endpoints.
Furthermore, the introduction of Copilot for Data Factory has revolutionized the authoring experience. Developers now utilize natural language prompts to generate complex Power Query M-code, significantly reducing development cycles.
The governance and monitoring frameworks have also been entirely reimagined. Administrators now leverage Kusto Query Language (KQL) and Real-Time Intelligence to monitor workspace activities at a granular, log-level depth.
What's Changed Since This Session
The transition to Microsoft Fabric has introduced a new generation of data flows and deprecated several legacy approaches. The following table summarizes the technological shifts since the original session.
| Technology from Original Session | Status in March 2026 | What Replaced It |
|---|---|---|
| Power BI Dataflows (Gen1) | Legacy Support | Fabric Dataflow Gen2 (Data Factory workload) |
| Linked & Computed Entities | Deprecated / Transformed | Staging (Lakehouse/Warehouse) & Query References |
| Premium P-SKUs | Retired (Dec 2024 / 2025) | Fabric Capacity (F-SKUs) |
| Workspace Usage Metrics | Legacy Support | Workspace Monitoring (Eventhouse / KQL) |
| Manual M-Code Authoring | Supported | Copilot for Data Factory (AI-Powered Prompts) |
| Internal Power BI Storage | Supported (Gen1) | Data Destinations (Lakehouse, SQL, Snowflake, Excel) |
How to Build This Today
The original presentation provided a foundational look at cloud-based Power Query. Today, the approach requires utilizing Microsoft Fabric's Dataflow Gen2. This modern iteration offers separated compute and storage, AI assistance, and expansive destination routing.
Creating a Cloud-Based Data Transformation Pipeline
The session showed you the step-by-step process to create your first data flow using Power Query Online, as cloud-based data transformation pipelines. Here's how you'd build that same thing today in March 2026.
Dataflow Gen2 fundamentally decouples the transformation logic from the underlying storage layer. Data is first ingested from sources like OData or ADLS, then transformed using the Power Query engine and Copilot. Next, it is staged within a hidden internal Lakehouse leveraging Fabric's SQL compute engines. Finally, the shaped data is routed to external destinations such as Fabric Lakehouses, Snowflake databases, Azure SQL, or even direct Excel files.
To initiate this process, a developer must navigate to the Microsoft Fabric service (app.fabric.microsoft.com). Within the interface, select a Fabric-enabled workspace from the left navigation pane.
Click the + New item button in the workspace toolbar. Next, select Dataflow Gen2 from the Data Factory section of the creation menu.
The modern Power Query Online editor will initialize instantly. This environment includes autosave capabilities and background validation, preventing the catastrophic data loss occasionally experienced in Gen1.
Click the Get data button, then select More... to open the modern connector gallery. Search for the desired source, such as the Northwind OData service, and select the connector.
Enter the connection credentials. Fabric will seamlessly utilize integrated Entra ID authentication or prompt for an On-Premises Data Gateway connection if the source is internal. Select the specific tables required from the navigator pane and click Create.
At this stage, the transformation logic begins. Instead of manually clicking through the ribbon to apply transformations, developers can now utilize Copilot for Data Factory.
Locate the Copilot button on the Home ribbon and open the chat pane. Enter a natural language prompt into the interface.
For example, a prompt might read: "Filter the data to only show European customers, group by City, and count the total number of orders.". Copilot will automatically generate the corresponding M-code and apply the sequential steps in the Applied Steps pane.
Quick Win: Do not spend time manually writing complex M-code for date extractions or conditional columns. Use the AI-Powered Prompt Transform feature (made Generally Available in March 2026). Simply type "Extract the month name from the OrderDate column" and Copilot will handle the syntax entirely.
Developers should review these AI-generated transformations using the new Preview-only steps feature. This capability, which reached General Availability in March 2026, allows users to test logic during the authoring phase without affecting the final production runtime behavior.
Once the data is shaped correctly, it must be routed to a final destination. Unlike Gen1, which trapped data in hidden Power BI storage, Gen2 allows routing to almost any enterprise location.
In the bottom right of the Query Settings pane, click the Add data destination button. Select a destination such as Fabric Lakehouse, Azure SQL Database, or the newly supported Snowflake destination.
Choose whether to Append new records to the existing data or Replace the existing table entirely. Finally, click Publish in the bottom right corner.
The publication process now uses parallelized query validations, a performance upgrade released at FabCon Atlanta 2026. This drastically reduces the time it takes to save and deploy the data flow, particularly for pipelines with numerous complex queries.
The execution is handled by the Modern Query Evaluator, which provides improved optimization across common shaping patterns like joins and group-bys.
Defining Reusable Transformation Logic
The session showed you defining entities, linked entities, and computed entities for efficient reuse in preparing shared data for multiple datasets or reports. Here's how you'd build that same thing today in March 2026.
The underlying architecture for logic reuse has completely changed to leverage Fabric's enhanced compute capabilities. In Dataflow Gen2, the legacy concepts of "Linked Entities" and "Computed Entities" are obsolete.
These concepts have been replaced by standard Query References combined with automatic Staging. Staging utilizes Fabric's SQL compute engines to process transformations significantly faster than the legacy Power Query mashup engine.
To build a reusable pipeline, open an existing Dataflow Gen2 item in the Fabric workspace. In the Queries pane on the left, locate a base query that connects to a raw data source.
Right-click this base query and select Reference. This action creates a new query that points directly to the output of the base query.
This referenced query effectively serves the exact same purpose as a legacy computed entity. Rename this new query to reflect its specific downstream purpose, such as Dim_Customers_Filtered.
Apply any necessary secondary transformations to this referenced query. To ensure optimal performance, developers must understand how Gen2 handles the compute for these referenced operations.
By default, Dataflow Gen2 automatically enables Staging for all queries. Right-click the base query and verify that Enable staging is checked, which is indicated by a blue visual highlight in the editor.
When staging is active, Fabric automatically loads the base data into a hidden internal Lakehouse dedicated specifically to that dataflow. The referenced query will now execute its transformations using the powerful Fabric SQL engine against this internal Lakehouse.
This architectural shift bypasses the original source system entirely during the secondary transformations, vastly reducing source system load.
Quick Win: If a query is merely passing data through without complex transformations, right-click and disable staging. This forces the dataflow to write directly to the destination, saving Fabric Capacity Units (CUs) and reducing overall processing time.
The final step in reusing logic is managing how these referenced queries land within the broader data estate. Gen2 allows each referenced query to possess its own distinct data destination.
Select the newly referenced query and click the Data destination icon. Choose the appropriate landing zone for the curated data.
To ensure schema consistency across multiple downstream reports, select the Fixed Schema option in the destination managed settings. This configuration prevents unauthorized schema drift during subsequent refreshes.
Any report relying on this reused logic will remain stable, as the dataflow will fail rather than push a breaking column change to the destination.
Furthermore, developers can utilize the new Fabric Variable Library to parameterize these reusable flows across different environments. This feature reached General Availability in March 2026, removing the previous 50-variable limit.
Open the Variable Library from the workspace settings. Define environment-specific endpoints, such as different SQL server connection strings for Development and Production.
Inject these variables directly into the Dataflow Gen2 source settings. This paradigm allows the exact same transformation logic to be promoted across environments via CI/CD pipelines without requiring any manual code edits.
For massive enterprise migrations, administrators can also use the new Save As API. This API allows teams to programmatically clone legacy Gen1 dataflows into Gen2 while automatically inheriting scheduled refresh policies.
Implementing Incremental Refresh for Large Datasets
The session showed you setting parameters for incremental refresh with date-based filtering to speed up refreshes and handle large datasets. Here's how you'd build that same thing today in March 2026.
Configuring incremental refresh in Dataflow Gen2 is heavily streamlined compared to the legacy approach. Gen2 utilizes a fixed-bucket architecture rather than the legacy partition-based merging algorithm.
This modern incremental refresh replaces specific time buckets in the data destination, allowing for massive scalability while keeping compute costs highly predictable. The configuration process is now managed entirely through a graphical interface, eliminating the need to manually define RangeStart and RangeEnd parameters in Power Query.
Open the target Dataflow Gen2 pipeline and select the query that requires incremental loading. Ensure the data preview reveals a valid Date, DateTime, or DateTimeZone column, as this is required for time-slicing.
Crucially, the query must support Query Folding. If the query does not fold, the Fabric mashup engine will attempt to pull the entire historical dataset into memory before filtering, completely negating the performance benefits of incremental refresh.
Right-click the query in the left navigation pane and select Incremental refresh. The Incremental Refresh settings dialog will seamlessly appear over the canvas.
In the Choose a column to filter by dropdown, select the target date column, such as ModifiedDate or OrderDate. Define the Extraction period to dictate the rolling window of historical data to maintain (e.g., "Extract data from the past 2 Years").
Next, define the Bucket size. Gen2 divides the data into fixed single-unit partitions, such as Days, Months, or Quarters.
Select a bucket size that strictly aligns with the business updating frequency. For a daily reporting cycle, a bucket size of "1 Day" ensures maximum granularity during the refresh cycle.
A highly recommended practice is utilizing the change detection mechanism to further reduce compute overhead. Toggle the option labeled: Only extract new data when the maximum value in this column changes.
Select a high-watermark column from the dropdown. This is frequently the same ModifiedDate column used for filtering.
With this specific setting enabled, Fabric will evaluate the maximum value within the source bucket before extracting any data. If the value has not changed since the last execution, the engine skips the bucket entirely, consuming absolutely zero compute resources for that specific partition.
Click OK to save the incremental settings. Next, configure the data destination for the query.
Incremental refresh in Gen2 explicitly requires the destination to be set to Replace mode and utilize a Fixed Schema. The system does not support dynamic schemas for incremental loads.
Warning: Do not attempt to use "Append" mode with incremental refresh in Dataflow Gen2. The system forcibly enforces "Replace" mode at the individual bucket level. If an append-only architecture is strictly required, developers must use a separate pipeline notebook or the "Incremental Amass" staging pattern.
For Lakehouse destinations, ensure that backend Delta table vacuuming is temporarily disabled during the refresh window. Vacuuming can aggressively interfere with the incremental refresh process and cause unexpected timeouts.
Publish the data flow to finalize the configuration. Once published, the initial execution will perform a full historical load based on the defined extraction period.
All subsequent automated executions will process only the specific time buckets that fall within the refresh window or have detected data changes. This dramatically accelerates pipeline completion times and minimizes API calls against the source systems.
Integrating Outputs with Excel
The session showed you integration options with Excel via Analyze in Excel for PivotTable consumption of data flow outputs. Here's how you'd build that same thing today in March 2026.
While the classic "Analyze in Excel" feature remains a staple for business users, the integration landscape has expanded drastically. The modern ecosystem offers live connected tables and the ability to push physical Excel files directly to file systems.
Analysts no longer need to rely solely on PivotTables. They can pull live data directly into the standard Excel grid, or rely on Dataflow Gen2 to act as an automated report generation engine.
To utilize the modern "Analyze in Excel" experience, navigate to the Fabric workspace containing the published semantic model. Click the More options (...) menu located next to the model name. Select Analyze in Excel from the dropdown menu.
Historically, this action downloaded a local .odc connection file to the user's hard drive. Today, the process is tightly integrated with the Microsoft 365 cloud ecosystem.
Fabric automatically generates the Excel workbook and saves it directly to the user's OneDrive for Business account. The file subsequently opens immediately in Excel for the Web.
The user is presented with an empty PivotTable that maintains a live connection to the Fabric semantic model via the XMLA endpoint. As users drag and drop fields, Excel dynamically generates DAX queries and sends them to the Fabric compute engine.
For users who strongly prefer raw data rows over aggregated PivotTables, Microsoft introduced Connected Excel Tables.
To leverage this, open a published report within the Power BI service. Hover over any specific visual, such as a matrix or a standard table, and click the More options (...) ellipsis.
Select Export data from the context menu. Choose the newly integrated option to export as a Live connected table.
Excel will launch automatically with the raw data loaded directly into the standard spreadsheet grid. This data is not static; it maintains an active connection to the underlying model.
Users can click the Refresh button on the Excel Data ribbon at any time. This action forces Excel to pull the absolute latest numbers directly from the Fabric engine, ensuring the spreadsheet never falls out of sync.
The most significant advancement in 2026 is the ability for Dataflow Gen2 to bypass semantic models entirely and generate physical Excel files.
Open a Dataflow Gen2 pipeline in edit mode. Select the final transformed query that contains the report-ready data.
Click Add data destination and choose either SharePoint or Azure Data Lake Storage Gen2 as the target location. In the destination settings dialogue, select Excel File as the requested output format. This capability transitioned into public preview in March 2026.
Configure the specific output type required by the business. Select Sheet to output standard tabular rows. Alternatively, select Chart to instruct the dataflow to automatically generate a pre-configured Excel chart embedded within the .xlsx file.
Quick Win:
For legacy business processes that demand daily Excel attachments, use the Multi-sheet format setting in the destination configuration. Select a partition column (e.g., Region), and the dataflow will automatically generate a single Excel workbook with separate, cleanly formatted tabs for each distinct region.
Publish the dataflow to finalize the setup. Every scheduled refresh will now automatically overwrite or append the physical Excel file in SharePoint with fresh data.
This operational reporting mechanism is highly valuable for stakeholders who refuse to log into dashboards and insist on working natively within Excel workbooks.
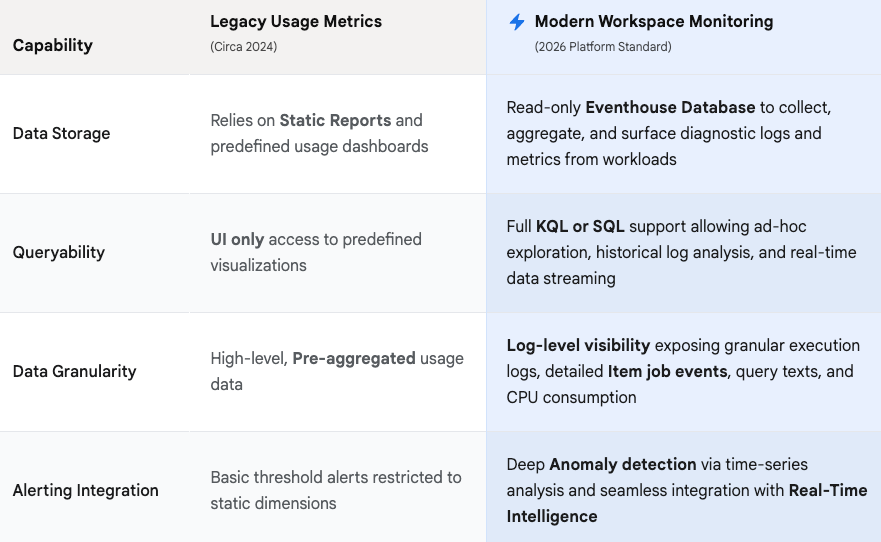
Monitoring Usage and Tracking Refreshes
The session showed you monitoring usage with workspace analytics to track data flows serving the most datasets. Here's how you'd build that same thing today in March 2026.
Legacy usage metrics and standalone diagnostic apps have been entirely superseded by Workspace Monitoring. This enterprise-grade observability suite is powered by Fabric Real-Time Intelligence and KQL databases.
Administrators no longer rely on simple, pre-aggregated usage dashboards. They now possess log-level visibility into every execution, CPU spike, capacity usage trend, and failure pattern across the entire workspace.
To utilize this advanced telemetry, the feature must first be explicitly enabled by a workspace administrator.
Navigate to the target Fabric workspace and click Workspace Settings in the top menu bar. Select the Monitoring tab from the left-hand settings menu.
Toggle the switch to Turn on Log workspace activity. This immediate action triggers the automatic provisioning of a secure, read-only Eventhouse database inside the current workspace.
Fabric will instantaneously begin streaming granular diagnostic logs and execution metrics into this database. Close the settings panel and locate the new Monitoring Database (Eventhouse) item populating in the workspace artifact list.
Click to open the Eventhouse. To track data flow executions, failures, and system diagnostics, developers can query the underlying tables directly using Kusto Query Language (KQL).
Open a new KQL Queryset window within the Eventhouse experience. Write a query targeting the ItemJobEventLogs table. This specific table captures highly detailed execution telemetry for all pipeline and dataflow runs.
For example, to identify recent dataflow failures across the workspace, execute the following KQL query:
Code snippet
ItemJobEventLogs

| where ItemKind == "Dataflow" and JobStatus == "Failed"
| order by Timestamp desc
| project Timestamp, ItemName, JobStartTime, JobEndTime, SystemDiagnostics
This code snippet immediately surfaces the exact timestamp, item name, and diagnostic error message for every failed dataflow.
Instead of constantly writing manual KQL queries, developers can leverage Microsoft's out-of-the-box visual templates. In the upper ribbon of the Monitoring Eventhouse, click the Fabric Monitoring button.
Select the Eventhouse Monitoring Dashboard or the Semantic Model Monitoring Dashboard from the prompt. These pre-built, real-time dashboards instantly visualize ingestion results, command metrics, query performance, and refresh overlaps without requiring any manual report development.
The Evolution of Fabric Workspace Observability
Workspace Monitoring transforms telemetry into a first class data asset, allowing administrators to use KQL for deep anomaly detection across Dataflow Gen2 and semantic models.
Quick Win: Use the Monitoring Hub for day-to-day operational checks. Accessible via the left-hand navigation menu, the Hub provides a centralized, cross-workspace view of all running, succeeded, and failed jobs. You can filter specifically by "Dataflow Gen2" to immediately spot bottlenecks or timeouts without writing a single line of KQL.
For proactive governance, Dataflow Gen2 now supports native email alerting tied directly to operational failures.
Open the Dataflow settings menu. Navigate to the Refresh section and configure the Failure Notifications block.
Input target email addresses or distribution lists to ensure data engineering teams are alerted instantly if a scheduled dataflow times out or crashes. This automated alerting eliminates the need to actively monitor dashboards, drastically reducing time-to-detect for broken pipelines.
Licensing Quick Reference
The licensing structure for Power BI and Microsoft Fabric underwent significant changes following global price adjustments enacted in April 2025. Additionally, Microsoft has actively retired the legacy Premium capacity SKUs (P-SKUs), forcing a transition to the unified Fabric capacity model.
Organizations previously relying on Power BI Premium must transition to equivalent F-SKUs (e.g., migrating from a P1 to an F64 capacity) to maintain operational continuity.
The following table outlines the current March 2026 licensing requirements and pricing structures necessary for executing the Dataflow Gen2 and monitoring architectures detailed in this report.
| License Type | 2026 Pricing (USD) | Core Capabilities for Dataflows & Fabric |
|---|---|---|
| Power BI Pro | $14 / user / month | Required to publish reports. Authors simple Gen1 dataflows. Cannot run Dataflow Gen2 or Fabric items. |
| Premium Per User (PPU) | $24 / user / month | Advanced Gen1 AI/Compute. Does not provision Fabric capacity. Cannot run Dataflow Gen2. |
| Fabric Capacity (F-SKUs) | Pay-As-You-Go or Reserved | Required for all Dataflow Gen2 workloads, Lakehouse staging, and Workspace Monitoring. |
| Fabric F64 (or higher) | ~$5,000 / month (Reserved) | Runs all Dataflow Gen2 workloads. Allows users with Free licenses to view published reports. |
Important Note on Capacity: To build Dataflow Gen2 pipelines, utilize Lakehouse destinations, or enable Workspace Monitoring Eventhouses, the workspace must be actively backed by a Fabric Capacity (F-SKU) or an active Fabric Trial.
For aggressive cost optimization, organizations that do not require free viewer access can utilize smaller, highly affordable capacities (e.g., F2 to F32). These smaller tiers are perfectly capable of running heavy data engineering workloads, provided all users consuming the final reports hold a standard Power BI Pro license.
Briefing published by Collab365 Spaces. Cite as "Curious About Data Flows? - 2026 Update", Collab365 Spaces. 10 sources referenced.