What's Changed Since This Session
The landscape of Microsoft Power BI Desktop has shifted profoundly since the original workshop by Jessica Jolly in 2020. Manual Data Analysis Expressions (DAX) authoring and formula bar debugging have been largely superseded by AI-driven workflows and dedicated query environments. The core DAX engine remains the same, but the tooling surrounding it has evolved to prioritize speed, visual-level context, and natural language generation.
Developers now operate within a highly integrated Microsoft Fabric ecosystem. This environment centralizes semantic model management and introduces capabilities like Direct Lake, which fundamentally alter how data is processed and queried. The traditional reliance on external community tools for basic debugging or scripting has been mitigated by native application features.
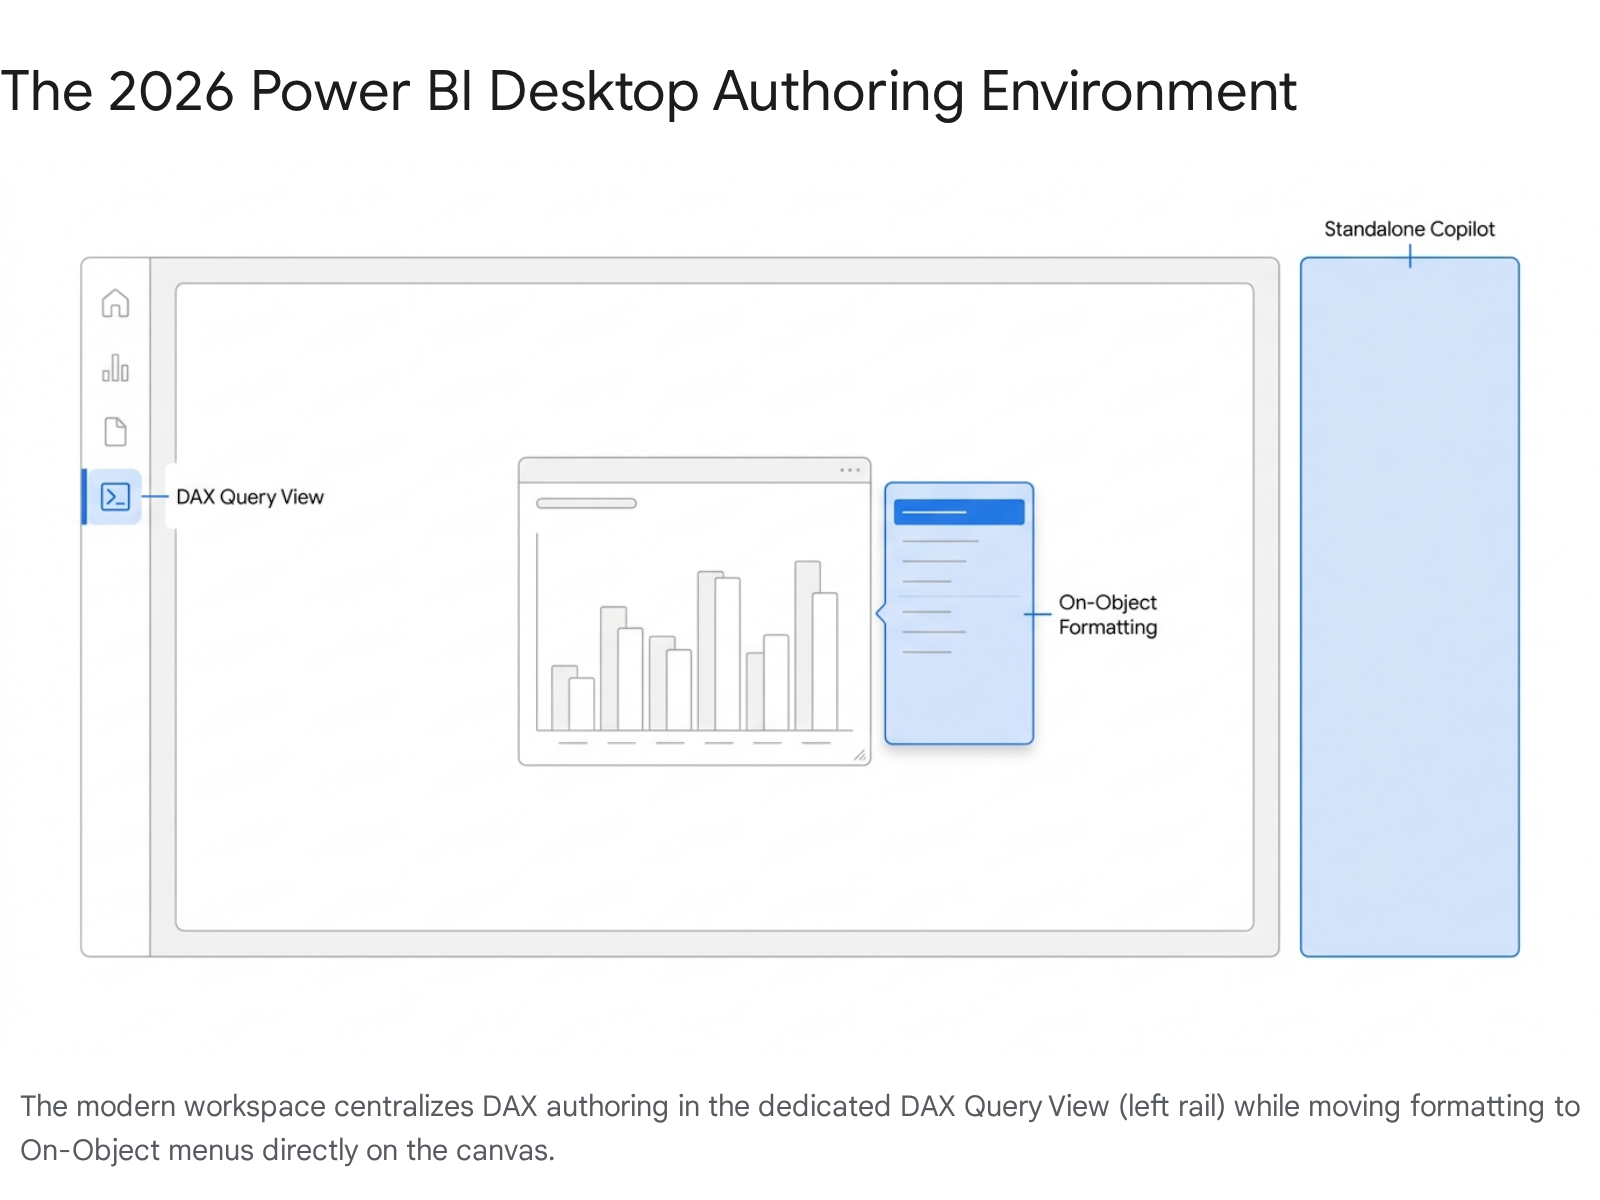
The user interface itself has been modernized, aligning with the Fluent 2 design system. This introduces uniform padding, smooth chart lines, and intelligent leader lines as standard defaults, replacing the legacy formatting menus with intuitive on-object interaction. Consequently, the workflows demonstrated in the original training session require significant translation to match the April 2026 best practices.
The table below outlines the specific technological shifts relevant to the original session's curriculum.
| Technology / Concept | Status in 2026 | What Replaced It |
|---|---|---|
| Manual DAX Authoring | Legacy / Optional | Copilot in Power BI: Natural language to DAX generation using the inline editor (CTRL+I). |
| Formula Bar Debugging | Legacy / Slow | DAX Query View: Dedicated, native environment for writing, testing, and debugging EVALUATE statements. |
| Complex UI Measures | Superseded in many cases | Visual Calculations: DAX executed directly on the visual matrix, replacing many CALCULATE and ALLSELECTED patterns. |
| Copy/Pasting Text Files | Obsolete | "Update model with changes": Push DAX directly from Query View to the semantic model with one click. |
| Format Pane Filtering | Legacy | On-Object Interaction: Build and format visuals, including adding data filters, directly on the canvas. |
| Model Documentation | Manual / External Tools | INFO.VIEW Functions: Native DAX functions to query model metadata (tables, columns, measures) instantly. |
| Standard Visual Defaults | Updated | Fluent 2 Styling: Modern default themes with uniform padding, smooth lines, and intelligent leader lines. |
How to Build This Today
1. Adding a Calculated Column
The session showed you: Participants open pre-built Northwind PBIX file with data model (fact table 'Orders Details', dimensions like Customers, Products). Add calculated column to 'Orders Details': Line_Item_Total = 'Orders Details'[UnitPrice] * 'Orders Details'[Quantity]. Here's how you'd build that same thing in April 2026.
Modern Power BI Desktop heavily relies on AI to streamline foundational modeling tasks. While manual DAX entry remains functional, the primary workflow shifts toward natural language generation. To replicate the Northwind environment today, developers connect directly to Microsoft's official OData feed via the Home > Get Data > OData feed menu path.
Entering the URL https://services.odata.org/V4/Northwind/Northwind.svc/ into the connection dialog loads the Navigator. From here, selecting the Order_Details table and clicking Transform data brings the information into the Power Query Editor. Once the data types are confirmed and loaded, the developer navigates to the Model view, the third icon on the left navigation rail.
Selecting the Order_Details table in the Data pane reveals the properties and structure. To add a column, right-clicking the table name and selecting New column opens the formula bar. Instead of typing the DAX formula manually, the 2026 workflow utilizes the Copilot integration.
By pressing CTRL + I within the formula bar, the inline Copilot prompt appears. The developer types a natural language prompt such as "Multiply UnitPrice by Quantity" and presses Enter. The AI agent analyzes the semantic model and generates the following DAX syntax 18:
Code snippet
Line_Item_Total = 'Order_Details'[UnitPrice] * 'Order_Details'[Quantity]
Reviewing the generated syntax ensures accuracy. Once verified, clicking the checkmark or pressing Enter commits the column to the model.
Quick Win: Press CTRL + I while in the DAX Query View or formula bar to instantly open the inline Copilot prompt. Pasting plain English instructions is now the absolute fastest way to initiate calculations without memorizing syntax.
Calculated columns inherently understand row context. Because the calculation evaluates row by row during data refresh, it stores the results physically within the VertiPaq engine. This increases the overall semantic model size in memory.
For modern performance optimization, architects must ensure this calculation is absolutely necessary as a physical column. If the resulting value is only needed for a specific visual aggregation, a dynamic measure or a 2026 Visual Calculation is highly preferred.
This distinction is particularly critical when operating in Microsoft Fabric's Direct Lake mode. Direct Lake reads Delta Parquet files directly from OneLake. If complex calculated columns are added that cannot be seamlessly transcoded on the fly, the engine may fall back to standard DirectQuery mode. This fallback causes severe performance degradation, emphasizing the need to minimize physical calculated columns in enterprise deployments.
2. Building CALCULATE Measures Treating Filters as Tables
The session showed you: Build CALCULATE measures treating filters as tables, e.g., using CALCULATE(SUM(...), filter table) to modify context. Here's how you'd build that same thing in April 2026.
The fundamental behavior of CALCULATE has not changed; it remains the only DAX function capable of modifying filter context. However, the environment where developers build and test these expressions has completely transformed. Instead of building measures blindly on the report canvas and waiting for visuals to render, developers now navigate to the DAX Query View.
This dedicated workspace is accessed via the fourth icon on the left navigation bar. It allows professionals to write, format, and evaluate DAX queries independently of the report layer. To test a CALCULATE expression that treats a filter as a table, a developer creates a new query tab within this view.
Every DAX query requires an EVALUATE statement. The DEFINE block is utilized to mock up the measure securely before committing it to the permanent semantic model.
Code snippet
DEFINE MEASURE 'Order_Details' = CALCULATE ( SUM ( 'Order_Details' ), FILTER ( ALL ( 'Products'[CategoryName] ), 'Products'[CategoryName] = "Beverages" ) ) EVALUATE SUMMARIZECOLUMNS ( 'Customers'[CompanyName], "High Value Sales", )
Running the query is accomplished by pressing F5 or selecting the Run button. The calculated results appear instantly in the bottom results grid, allowing for rapid iteration and debugging.
Treating a filter as a table inside CALCULATE is essential for implementing complex conditional logic. The FILTER function acts as an explicit iterator, returning a modified table that CALCULATE then applies to the underlying data model to shift the evaluation context.
In April 2026, Copilot drastically simplifies the authoring of these complex filter tables. Within the DAX Query View, clicking the Copilot button in the ribbon or pressing CTRL + I opens the command interface. Selecting the Write DAX query inspire button provides a structured starting point.
By typing "Show total sales for customers, but only include products in the Beverages category," Copilot is instructed to map the business logic. The AI agent automatically generates the necessary DEFINE and EVALUATE syntax, applying the correct table filter logic and outputting it to the editor.
Quick Win: Use the Explain this query feature for instant comprehension. Highlight any complex CALCULATE block in the editor, press CTRL + I, and ask Copilot to explain it. The AI will break down exactly how the filter table iterates and modifies the evaluation context.
If the logic requires modification, developers can chat iteratively with the inline Copilot to adjust parameters before execution. This conversational workflow entirely replaces the legacy method of searching documentation for specific filter modifier syntax. Once the query produces the desired results in the preview grid, it can be saved back to the model using native actions.
3. Removing Filters with ALL or REMOVEFILTERS
The session showed you: Create CALCULATE statement removing filters with ALL or REMOVEFILTERS on specific tables/columns. Here's how you'd build that same thing in April 2026.
Removing filters is a critical operation for calculating percentages of a grand total or comparing a subcategory against a parent baseline. REMOVEFILTERS serves as the modern, more readable alias for ALL when used specifically as a filter modifier inside a CALCULATE statement.
To author this logic efficiently in 2026, developers initiate the process in the DAX Query View. The Quick queries functionality within the Data pane significantly accelerates this task. By right-clicking the target field, such as Line_Item_Total, and selecting Quick queries > Define and evaluate, a baseline query is instantly generated.
The developer then modifies the generated code to establish a grand total measure that strips away regional or categorical slicing:
Code snippet
DEFINE MEASURE 'Order_Details' = CALCULATE( SUM('Order_Details'), REMOVEFILTERS('Customers') ) EVALUATE SUMMARIZECOLUMNS( 'Customers'[CompanyName], "Customer Sales", SUM('Order_Details'), "Total Sales", )
Evaluating the code populates the result grid. It will accurately display the individual customer sales adjacent to the duplicated, unfiltered grand total.
For analysts who prefer a purely UI-driven approach, the Quick measure feature remains available and has been enhanced with Copilot intelligence. Selecting the matrix visual on the report canvas and accessing the formatting pane allows the user to select New quick measure.
Under the Calculation dropdown, choosing Total for category (filters not applied) sets the template. The analyst drags the target base value and the category field into the appropriate interface slots. Power BI automatically scripts the underlying DAX using REMOVEFILTERS and adds it to the model.
However, the 2026 software update introduces a radical, more performant alternative: Visual Calculations. If the sole architectural purpose of removing a filter is to calculate a percent-of-total exclusively for a specific visual, writing traditional DAX measures is no longer considered best practice.
To utilize this new paradigm, the user selects the visual, right-clicks, and chooses New visual calculation. In the specialized formula bar, the following syntax is entered:
Code snippet
PercentOfTotal = DIVIDE(, COLLAPSEALL(, ROWS))
This visual calculation executes its logic directly on the visual's data matrix, completely bypassing the need to alter the semantic model's filter context at the engine level. COLLAPSEALL acts as a localized filter remover, stepping up the visual hierarchy. This execution model often leads to massive performance benefits, especially when connected to massive enterprise datasets via DirectQuery or Direct Lake.
Quick Win: For basic "Percent of Grand Total" requirements, bypass complex semantic DAX entirely. Visual Calculations are significantly faster to write, easier for junior analysts to maintain, and perform exceptionally well on large-scale models without bloating the measure count.
By constraining the calculation exclusively to the aggregated visual data, the engine avoids expensive full-table scans. This paradigm shift represents one of the most critical updates for report developers transitioning from older architectural methods. For detailed syntactical rules regarding visual calculation execution, users refer to the official Microsoft documentation at https://learn.microsoft.com/en-us/power-bi/transform-model/desktop-visual-calculations-overview.
4. Expanded Tables via Relationships
The session showed you: Demonstrate expanded tables via relationships in data model and how filters propagate. Here's how you'd build that same thing in April 2026.
The concept of expanded tables is a foundational pillar of DAX mechanics. When a one-to-many relationship is established between two entities, the table situated on the "many" side physically expands during query evaluation to natively include all corresponding columns from the "one" side.
In 2026, demonstrating and verifying this complex theoretical concept relies heavily on the new INFO.VIEW functions introduced natively to the DAX Query View. These metadata functions allow data architects to query the active semantic model structure directly, without relying on third-party utilities like DAX Studio.
Opening the DAX Query View provides the canvas for this exploration. To see exactly how tables are related and how they will subsequently expand, a developer executes the following standard query:
Code snippet
EVALUATE INFO.VIEW.RELATIONSHIPS()
This command returns a comprehensive result grid detailing every active and inactive relationship, the configured cross-filtering direction, and the exact cardinality parameters.
To physically demonstrate how filter propagation operates within an expanded table, the developer constructs an EVALUATE block. This script joins the Order_Details table (representing the many side) with the Products table (representing the one side) to reveal the unified data structure.
Code snippet
EVALUATE GENERATE ( TOPN ( , 'Order_Details' ), RELATEDTABLE ( 'Products' ) )
Executing this query visually proves to the developer that a filter applied to an upstream product dimension automatically propagates down to the granular sales details during engine evaluation.
In the April 2026 Power BI Desktop interface, understanding these relationships is further aided by generative AI capabilities. Navigating to the Model view and selecting a specific relationship line between two tables highlights the connection.
Opening the standalone Copilot pane on the right side of the application screen initiates the AI assistant. A developer types the prompt: "Summarize the relationship between Orders and Customers, and explain the filter flow."
Copilot leverages its new Fabric data agent capabilities to explicitly explain how filters flow down the designated one-to-many path. The AI translates the technical metadata into plain business language, detailing how the tables logically expand during DAX query execution to produce accurate aggregations. This natively integrated capability effectively replaces the historical need for external model documentation tools.
Quick Win: Use EVALUATE INFO.VIEW.TABLES() and INFO.VIEW.COLUMNS() directly within the DAX Query View. Developers can copy the output grid directly into Excel or a new report page to instantly generate a continuously updated, automated data dictionary for the organization.
For robust enterprise governance, developers often materialize these INFO.VIEW results using SELECTCOLUMNS and UNION statements to build interactive, self-documenting report pages. This ensures that any structural changes to the relationships or expanded table logic are immediately visible to downstream business consumers, maintaining transparency.
5. Filter Context vs. Row Context
The session showed you: Explore filter context (outer) vs row context (inner), order of evaluation. Here's how you'd build that same thing in April 2026.
Mastering context evaluation order remains the steepest learning curve when adopting DAX. Filter context dynamically restricts the data model based on visual coordinates, such as slicers, matrix rows, and axis categories. Conversely, row context strictly iterates through a specific table, evaluating an expression row by row.
To explore this interaction safely and accurately today, developers utilize the Performance Analyzer deeply integrated with the DAX Query View.
Navigating to the Report view exposes the canvas. Accessing the Optimize ribbon and selecting Performance Analyzer opens the monitoring pane. The developer clicks Start recording, followed by Refresh visuals to capture the engine activity.
Expanding the metric for a specific visual reveals the detailed execution times. Selecting the Run in DAX query view hyperlinked text is the critical next step. Power BI automatically switches the interface and generates a new query tab containing the exact, highly complex DAX query the underlying VertiPaq engine executed to render that visual.
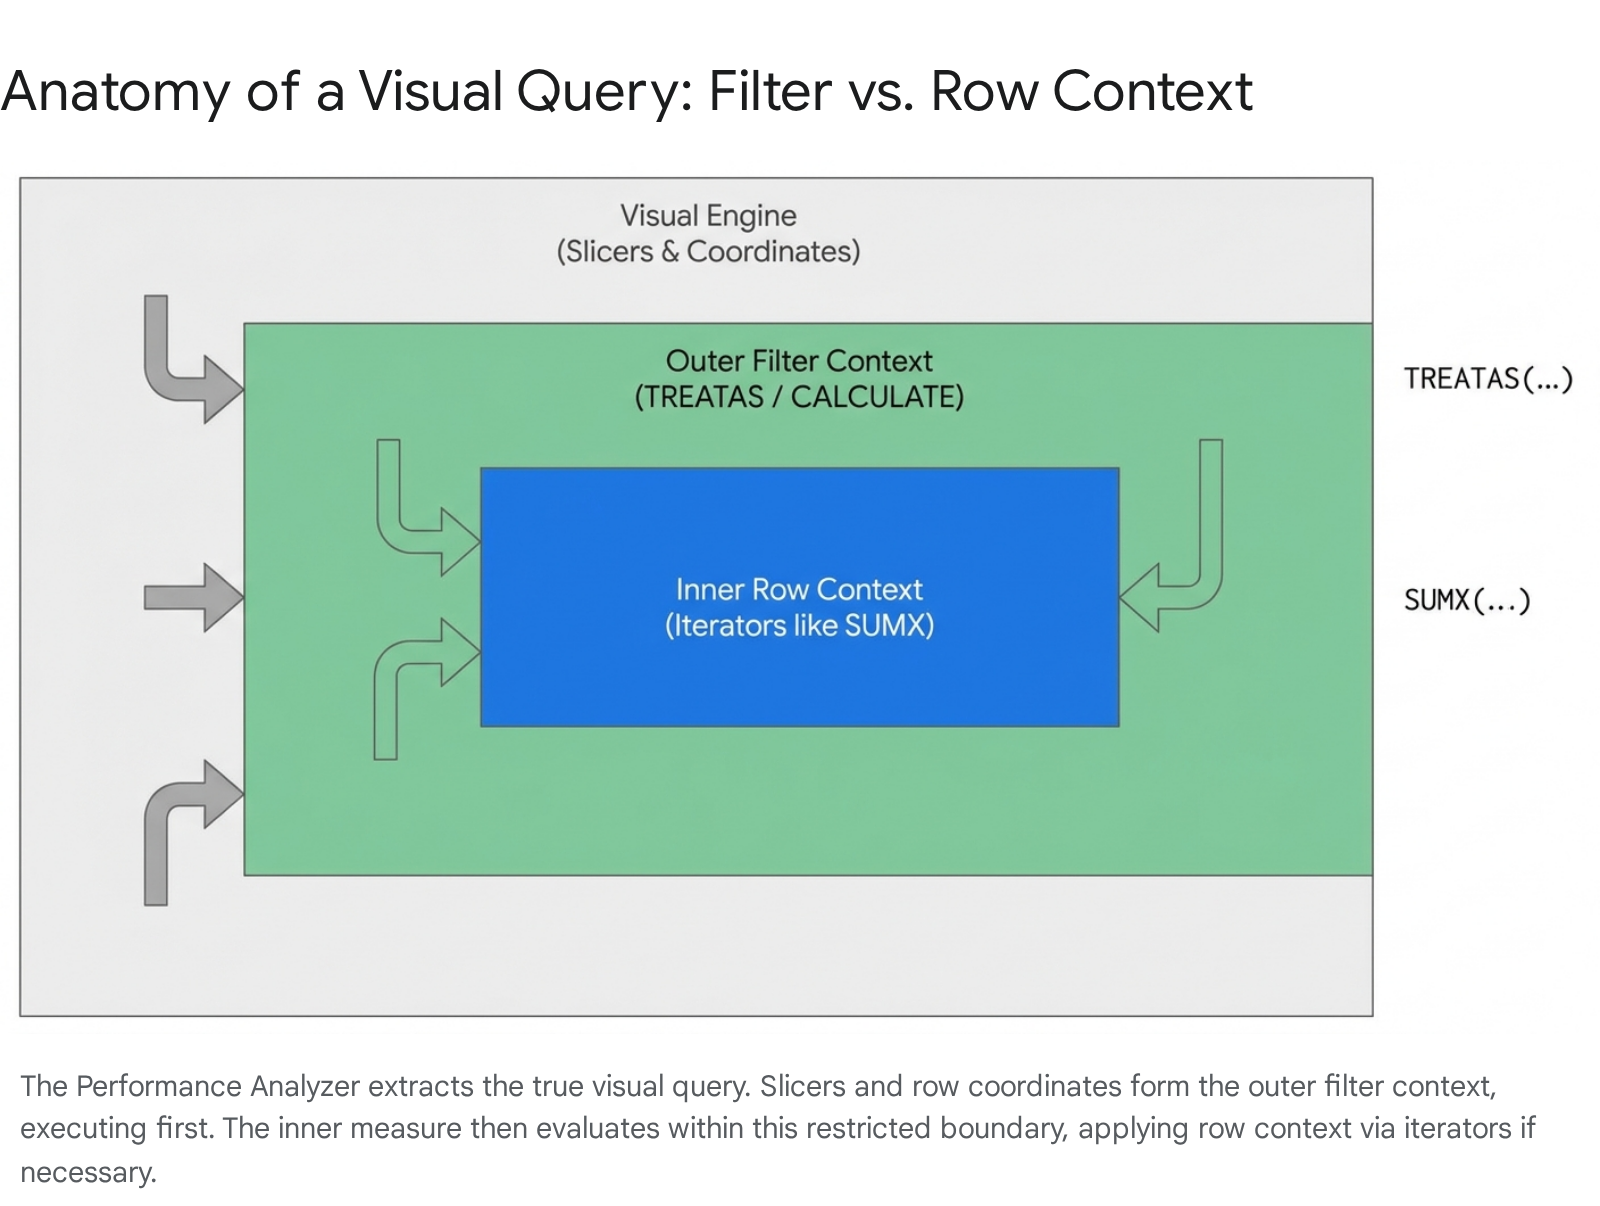
This auto-generated code explicitly exposes the outer filter context. Developers will observe TREATAS or KEEPFILTERS statements synthetically injected by the engine to represent the visual's slicers and coordinate system.
To isolate and examine the row context, developers scan the generated code for iterator functions, such as FILTER, SUMX, or AVERAGEX. These iterators define the inner boundaries where calculations execute sequentially against the data table.
If the precise evaluation order remains ambiguous, highlighting the entire block of code in the editor provides a solution. Pressing CTRL + I summons the inline Copilot interface.
Selecting the Explain a DAX topic inspire button guides the AI's focus. The developer types: "Explain how filter context and row context interact specifically in this generated query."
Copilot processes the request and delivers a contextual explanation tied directly to the actual semantic model. It details precisely which outer filters are applied first by the visual, and subsequently how the inner row context iterates over the restricted dataset to produce the final aggregated value.
Quick Win: Never guess visual context based on report canvas behavior. Always use the "Run in DAX query view" button from the Performance Analyzer. It extracts the hidden outer filter context generated by slicers and page filters, making the invisible engine logic completely visible.
By consistently utilizing the Performance Analyzer to extract the true query, data professionals avoid the common pitfall of assuming a measure behaves identically across different visual structures. The DAX Query View provides the necessary isolation to deconstruct these complex interactions safely before deploying the logic to production workspaces. Official guidance on query construction is available at https://learn.microsoft.com/en-us/power-bi/transform-model/dax-query-view.
6. Context Transition in Measures vs. Columns
The session showed you: Context transition (automatic) in measures vs calculated columns. Here's how you'd build that same thing in April 2026.
Context transition represents the mechanical process where an active row context is automatically transformed into an equivalent filter context. This transition occurs implicitly when any measure is invoked inside an existing row context, or explicitly when developers wrap logic in CALCULATE inside a calculated column.
To demonstrate this behavior effectively in 2026, the workflow begins in the Model view. Selecting the Customers dimension table and right-clicking to choose New column opens the necessary formula interface.
The objective is to calculate total historical sales for each individual customer. Entering a simple aggregate function without CALCULATE serves as the baseline test:
Code snippet
Total_Sales_No_Transition = SUM('Order_Details')
As theoretically expected, this expression returns the identical grand total for every single row. This occurs because there is no mechanism to trigger context transition; the simple SUM ignores the surrounding row context of the customer table.
To achieve the correct result, a pre-existing measure must be invoked. In the modern workspace, developers leverage the Standalone Copilot to construct this logic rapidly. Prompting Copilot with "Create a calculated column showing total sales for each customer using the existing sales measure" yields the correct approach.
Copilot returns the following syntax:
Code snippet
Total_Sales_With_Transition =
Because `` is inherently wrapped in a hidden CALCULATE statement by the engine, context transition fires automatically upon evaluation. The specific row context of each individual customer transforms into a filter context, yielding the correct, granular individual totals for that specific entity.
If the returned results appear incorrect during development, debugging context transition is now seamless without impacting model size. Opening the DAX Query View provides the testing ground.
Using the EVALUATE statement combined with ADDCOLUMNS allows the developer to simulate the calculated column's behavior entirely in memory.
Code snippet
EVALUATE ADDCOLUMNS( 'Customers', "Simulated Measure Transition", )
Running the query displays the simulated output. If the numbers match business expectations, the context transition logic is validated and mathematically sound.
Quick Win: Avoid creating physical calculated columns simply to trigger and test context transition logic. Use the DAX Query View to prototype the transition using ADDCOLUMNS. Only commit to a physical column if that data point is strictly required for a categorical axis or a visual slicer.
Understanding when context transition occurs implicitly is crucial for preventing severe performance degradation. Invoking complex measures inside heavy iterators can cause massive recursive calculations, severely taxing the available Fabric compute capacity. Using the DAX Query View to prototype these transitions ensures that only optimized logic is promoted to the production semantic model.
7. Slicer Control with ALLSELECTED and KEEPFILTERS
The session showed you: Use ALLSELECTED, KEEPFILTERS, ALLEXCEPT modifiers in CALCULATE for slicer control. Here's how you'd build that same thing in April 2026.
Modifiers embedded inside CALCULATE strictly govern how visual interactions, specifically slicers and page-level filters, alter the underlying DAX calculation.
To build these specific modifier patterns today, developers open the DAX Query View. Assuming a scenario where a matrix visual is dynamically sliced by Year and Category, precise control is required.
To write an ALLSELECTED measure that respects the outer report-level slicer but ignores the inner visual row context, the developer invokes the inline Copilot by pressing CTRL + I.
The prompt is formulated: "Create a measure for Total Sales that ignores the Category row filter in the visual, but still respects the overall Year slicer."
Copilot processes the context and generates the precise modifier block:
Code snippet
DEFINE MEASURE 'Order_Details' = CALCULATE( SUM('Order_Details'), ALLSELECTED('Products'[CategoryName]) ) EVALUATE...
Similarly, the KEEPFILTERS modifier ensures that new filters applied inside CALCULATE intersect with the existing visual context, rather than aggressively overwriting it.
While these traditional DAX modifiers remain undeniably powerful, Visual Calculations provide a profoundly modernized alternative for many common reporting scenarios.
If the analytical goal is to construct a running total or a moving average that natively respects user slicers but ignores specific visual rows for accumulation, the developer clicks the target visual and selects New visual calculation.
The user employs the RUNNINGSUM or MOVINGAVERAGE visual functions directly within the on-object interface.
Code snippet
Visual_Running_Total = RUNNINGSUM(, ROWS)
Visual calculations operate securely on the aggregated data payload after all external slicers (effectively the ALLSELECTED context) are already applied by the engine. This architecture completely eliminates the fundamental need to author complex CALCULATE modifiers for simple visual-level tasks, drastically reducing initial development time and long-term DAX maintenance complexity.
Furthermore, the April 2026 update introduces new Input Slicer conditional formatting capabilities. Report authors can now dynamically alter slicer visual appearances based on these calculated measure states directly from the updated On-Object interaction menus. This integration of Fluent 2 design principles ensures the interface remains clean while supporting deep data exploration.
Quick Win: Before committing to writing a highly complex ALLSELECTED or ALLEXCEPT pattern, evaluate the scope. Ask: "Is this calculation utilized exclusively on this specific chart?" If yes, a Visual Calculation is preferred. It is significantly faster to author and executes more efficiently.
8. Row Context with Iterators like SUMX
The session showed you: Row context with iterators like SUMX for gross sales totals, e.g., SUMX('Orders Details',). Here's how you'd build that same thing in April 2026.
Iterators are specialized functions that mechanically step through a specified table row by row, execute an inner expression within that strict row context, and then mathematically aggregate the final results.
In the modern 2026 workspace, building a SUMX measure effectively starts in the DAX Query View.
Pressing CTRL + I invokes the Copilot agent. The developer provides the prompt: "Create a measure that calculates total gross sales by multiplying Quantity by Unit Price row by row across the Order Details table."
Copilot evaluates the semantic model relationships and generates the precise iterator syntax:
Code snippet
DEFINE MEASURE 'Order_Details' = SUMX( 'Order_Details', 'Order_Details'[UnitPrice] * 'Order_Details'[Quantity] )
Clicking Run evaluates the query and previews the financial results instantly in the grid.
The primary architectural consideration when using iterators in 2026 is execution performance. While SUMX is mathematically necessary for complex line-level arithmetic, it is computationally expensive over massive datasets, particularly when organizations operate in the newly prevalent Direct Lake mode.
In Microsoft Fabric's Direct Lake mode, data is read directly from OneLake storage layers without traditionally importing data into the VertiPaq memory. While read performance is remarkably close to standard Import mode, forcing complex iterators can cause the engine to struggle with transcodes. When this threshold is breached, it falls back to standard DirectQuery execution, causing severe analytical latency.
To proactively test iterator performance, developers utilize the DAX Query View alongside the Performance Analyzer to execute the measure under load. If the execution is sluggish, architects must verify the broader data pipeline. In Fabric environments, it is considered best practice to push simple row-by-row arithmetic (such as Price * Quantity) upstream into the Lakehouse Delta tables or via Dataflows Gen2.31
If upstreaming the logic is organizationally impossible, developers must ensure the SUMX function iterates over the absolute smallest table logically possible. DAX best practices dictate never iterating over a massive joined fact table if iterating over a pre-summarized dimension table yields the identical mathematical result.
Quick Win: If the semantic model operates in Direct Lake mode and a SUMX iterator is underperforming, push the multiplication logic upstream. Utilizing Fabric notebooks or Dataflows Gen2 to pre-calculate the line item total into a static column preserves compute capacity and guarantees near real-time performance.
9. Copy-Pasting Measures and Debugging
The session showed you: Copy-paste measures from text file into Power BI Desktop, debug with IntelliSense. Here's how you'd build that same thing in April 2026.
The historical workflow of storing DAX measures in external text files (like Notepad) and manually copy-pasting them individually into the Power BI formula bar is officially obsolete.
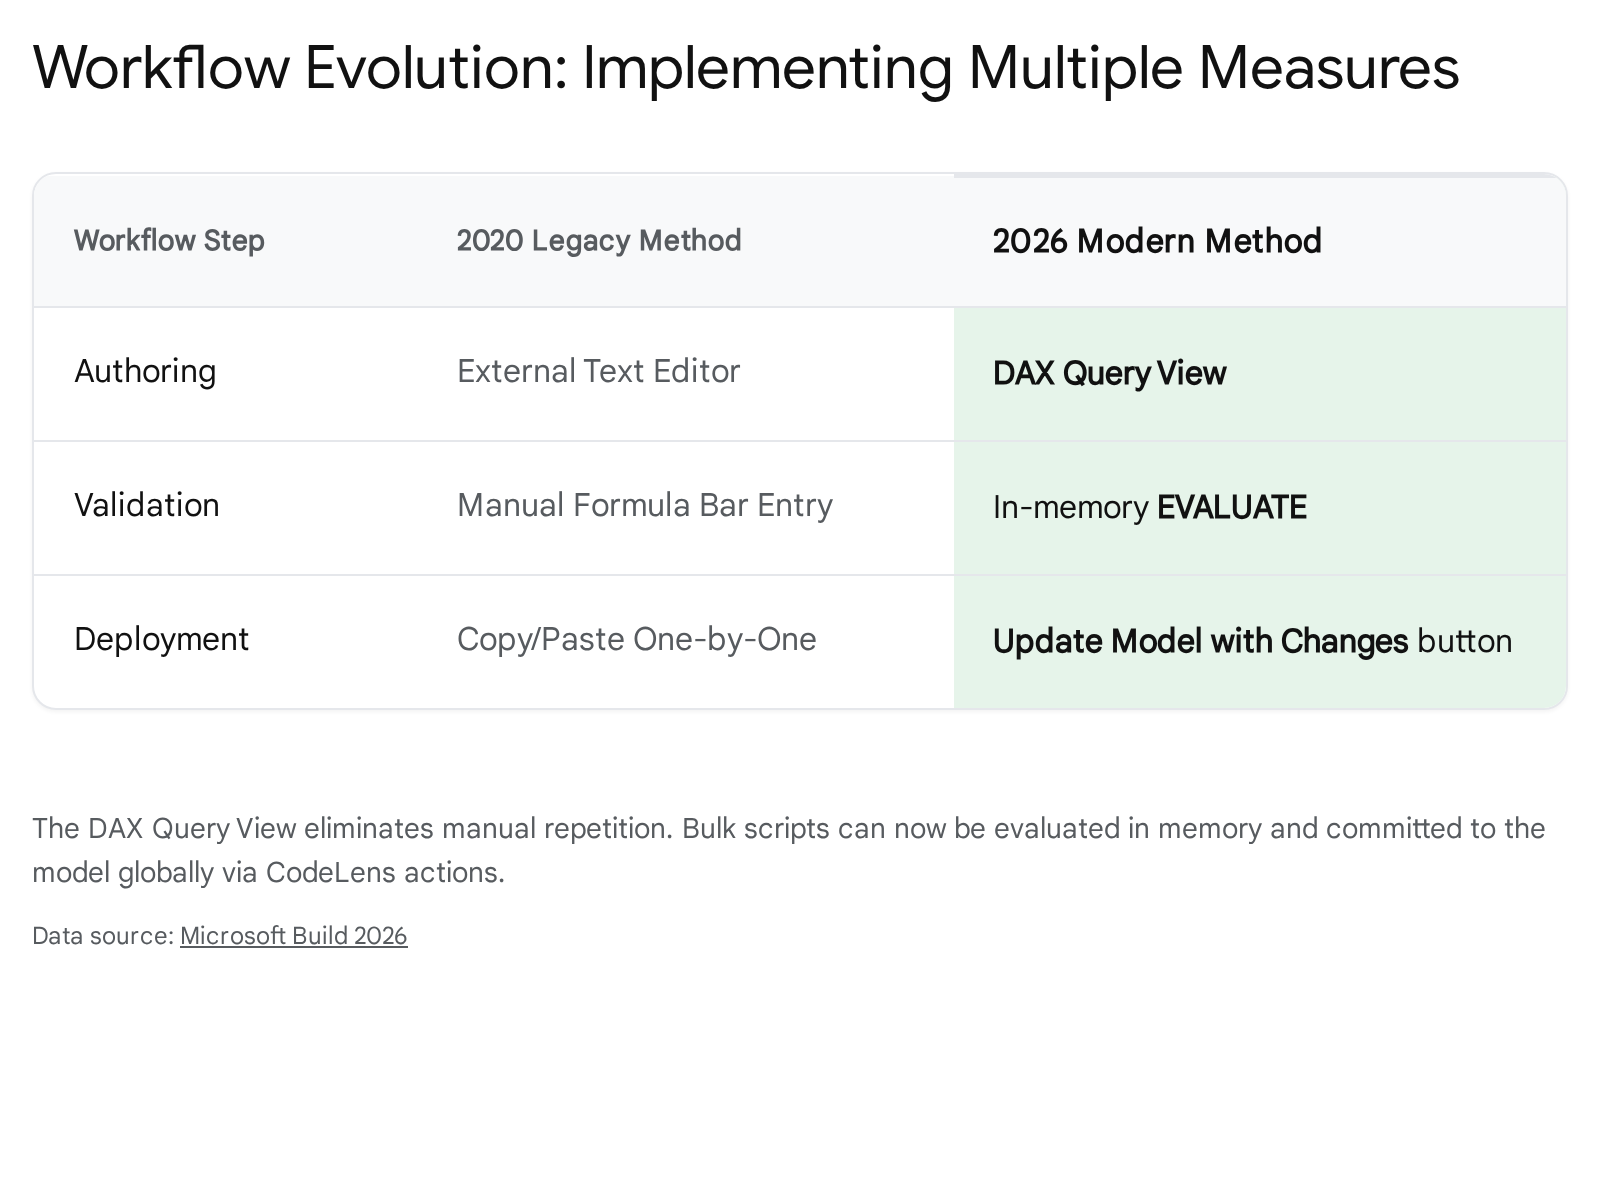
In April 2026, the native DAX Query View acts as the central command hub for bulk measure management, testing, and debugging.
If a colleague shares a complex DAX script, the modern workflow requires pasting the entire DEFINE MEASURE block directly into the DAX Query View editor workspace.
The built-in IntelliSense immediately validates the entire syntax payload against the active semantic model. If there are syntax or dependency errors, the developer selects the broken code block, presses CTRL + I, and simply asks Copilot to identify and fix the issue.
Once the measures are fully validated in the preview grid, developers no longer need to copy them one by one back into the physical model. The interface utilizes highly efficient CodeLens actions. Above each DEFINE MEASURE block in the editor, a clickable text prompt automatically appears, reading Update model: Overwrite measure or Update model: Add new measure.
Alternatively, clicking the universal Update model with changes button located in the primary ribbon executes a global commit. Power BI instantly parses the entire script and commits all new or modified measures to the underlying semantic model simultaneously, dramatically reducing deployment friction.
Furthermore, for large-scale enterprise deployments, the 2026 update introduces TMDL (Tabular Model Definition Language) View in web modeling.
This advanced feature allows lead developers to view, audit, and edit the semantic model's underlying source code directly within the Power BI Service via any web browser. TMDL represents the entire data model in a highly readable, folder-structured text format. This natively supports seamless Git integration, enabling professional source control, branch management, and CI/CD pipeline deployments without relying on external tabular editing tools.
Quick Win: Stop utilizing Notepad for DAX storage. Paste bulk scripts directly into the DAX Query View and click the Update model with changes button. It systematically compiles and commits hundreds of complex measures in a single click, completely eliminating manual data entry.
Licensing Quick Reference
Deploying these advanced DAX features, leveraging Copilot, and utilizing the modernized DAX Query View requires adherence to the correct organizational licensing structure. The introduction of Microsoft Fabric has expanded the available licensing tiers beyond the traditional standalone Power BI ecosystem. The current pricing metrics and feature capabilities remain stable and enforced as of April 2026.32
The primary distinction in modern licensing hinges on identifying who is authoring the DAX, where the resulting semantic models are hosted, and whether massive scale AI integration is required for the tenant. The older Premium "P-SKUs" are actively being retired by Microsoft to consolidate billing into the unified Fabric F-series capacities. It is critical to note that any user actively creating, editing, or publishing reports to any capacity strictly requires a foundational Pro license, regardless of the overarching F-SKU tier purchased by the enterprise.
The table below outlines the necessary licenses for authoring advanced DAX, accessing Copilot generation, and managing Semantic Models.
| License Type | Monthly Cost (USD) | Authoring Capabilities | Viewing Rules & Capacity |
|---|---|---|---|
| Power BI Pro | $14.00 / user | Full DAX Query View, standard semantic model editing, basic visual calculations. | Cannot host free viewers. A Pro license is strictly required for all consumers. |
| Premium Per User (PPU) | $24.00 / user | Advanced AI features, Copilot DAX generation, significantly larger model limits (100TB storage). | Cannot host free viewers. Viewers must also possess a Pro or PPU license to consume. |
| Fabric F-SKUs (F64+) | Capacity Based | Unlocks Copilot and deep AI capabilities comprehensively across the designated tenant workspaces. | Free viewers can consume content seamlessly without requiring an additional paid per-user license. |
Organizations must assess their concurrent user workload, the complexity of their DAX calculations, and the desired performance latency when selecting the appropriate capacity units (CUs) within the F-SKU framework. Fabric capacity overage allows for dynamic scaling during high-demand analytical periods, ensuring that complex DAX queries do not throttle critical business reporting. For detailed deployment strategies and SKU migrations, administrators should consult the official Microsoft Fabric enterprise licensing documentation.
Source note
Briefing published by Collab365 Spaces. Cite as "2026 Update: Using DAX to Filter Power BI Data", Collab365 Spaces. 10 sources referenced.