The landscape of data engineering within Microsoft Fabric has undergone a radical transformation since the original 2024 broadcasts. The shift from manual, code-heavy notebook authoring to agentic, AI-driven development has fundamentally redefined enterprise data workflows. This report serves as a definitive 2026 companion piece to Jessica Jolly’s original session, "Demystifying Notebooks in Fabric."
This is a companion piece assuming the reader has watched the session. The underlying architecture of Microsoft Fabric has matured into a unified, context-aware ecosystem that operates with full awareness of your workspace. Today, developers leverage deeply integrated AI agents, seamless visual debugging, and declarative data pipelines to achieve what previously required extensive scripting.
This guide bridges the gap between the foundational concepts demonstrated in the original session and the production-ready best practices established as of March 2026. We will explore exactly how the manual demonstrations of 2024 translate into the automated, AI-assisted reality of today.
What's Changed Since This Session
The primary evolution in Microsoft Fabric Notebooks centers on the transition from standalone coding environments to context-aware, AI-assisted development surfaces. The platform now operates with full awareness of the surrounding workspace, active execution environments, and connected data assets without requiring explicit session initialization.
The transition from manual engineering tasks to agentic, AI-assisted workflows defines the 2026 Microsoft Fabric ecosystem. A comparison of the 2024 baseline to the 2026 current state highlights a massive paradigm shift in automation, debugging, and overall platform architecture. The operational overhead of managing complex data pipelines has been significantly reduced across the board.
Manual PySpark transformations have largely been superseded by declarative frameworks and native AI integrations that handle boilerplate logic. The following summary table provides a quick reference for the high-level technological shifts you will encounter in this updated guide.
| Technology / Feature | Status in 2026 | What Replaced It (if applicable) |
|---|---|---|
| Manual PySpark Ingestion | Legacy Approach | Fabric Notebook Custom Agent & UI-driven Load to Tables. |
| Manual Markdown Typing | Deprecated Workflow | Copilot Context-Aware Generation (/document commands). |
| Trial-and-Error Debugging | Replaced | Fix with Copilot automated analysis & Web UI Visual Debugger. |
| Hand-Built Medallion ETL | Legacy Approach | Materialized Lake Views (GA) using declarative Spark SQL. |
| Isolated Notebook Storage | Enhanced | Resource Explorer with shared Environment folders. |
| Unencrypted Code Storage | Replaced for Enterprise | Customer Managed Key (CMK) Encryption for Notebook Code. |
The platform's security and governance models have also matured significantly. Notebooks are now fully supported in CMK-enabled workspaces, ensuring that core artifacts like cell source, outputs, and attachments are protected using customer-owned Azure Key Vault keys. This satisfies strict enterprise compliance requirements without forcing developers to change their authoring workflows.
Furthermore, the introduction of granular security contexts means you must be acutely aware of how a notebook is triggered. Notebooks can run interactively under your own identity, or they can be triggered by Data Factory pipelines where they execute under the identity of the pipeline's last modified user. This is a critical architectural change from the 2024 baseline.
How to Build This Today
The following sections dissect each original demonstration from Jessica Jolly's session. For every scenario, we will restate exactly what was shown in the original video. Then, we will provide the exact modern equivalents, utilizing the latest March 2026 features, user interfaces, and AI agents.
Scenario 1: Ingesting Excel Files Directly into a Lakehouse
The session showed you: Jessica demonstrating how to upload an Excel file and manually write Pandas or PySpark code to read the file. The demonstration involved defining the schema by hand, managing the ingestion of specific Excel worksheets, and writing the final output to a Delta table using trial-and-error code blocks.
Here's how you'd build that same thing today in March 2026:
Building this today relies heavily on automated UI tools for simple ingestions, and context-aware AI agents for complex, multi-sheet Excel files. The platform now offers direct visual ingestion paths alongside highly advanced, automated code generation. You no longer need to write boilerplate PySpark code just to land data into a Lakehouse.
For files that are perfectly clean and require no custom column schema definition, you should utilize the native UI-driven path. This bypasses the need for a notebook entirely for basic ingestion tasks. V-Order optimization is a write-time optimization applied to Delta Parquet files that enables lightning-fast reads by the Fabric compute engines.
Step-by-Step 2026 Instructions (UI Method):
- Navigate to the Workspace and Lakehouse: Open the Fabric portal, select your target Workspace from the left-hand navigation pane, and click on your Lakehouse item. The modern Lakehouse Explorer provides a unified, web-based view of all files and tables.
- Upload the Excel File: In the Lakehouse Explorer, locate the
Filessection on the left. Click the ellipsis (...) next to the folder and select Upload. Choose your local Excel or CSV file to place it directly into OneLake storage. - Execute Load to Tables: Right-click the uploaded file in the explorer and select Load to Tables, then choose New table.
- Validate and Load: In the resulting dialog box, review the suggested table name. Real-time validation applies while you type to ensure there are no spaces or special characters.Select Load to execute the ingestion. The system will automatically convert the file into a V-Order optimized Delta table.
However, the Load to Tables UI cannot define custom column schemas, nor can it easily handle complex multi-sheet Excel files natively. For robust enterprise ingestion, especially when dealing with specific worksheets or complex data types, you must utilize a modern Fabric Notebook. The workflow here has been completely revolutionized by the Fabric Notebook Custom Agent.
The Fabric Notebook Custom Agent is a Fabric-native AI development agent embedded directly in the Fabric Data Engineering VS Code extension. Unlike generic coding assistants, this agent operates with full awareness of your specific workspace, runtime, environments, and Lakehouse resources. It ensures that the code it generates for you is context-aware and safe.
Step-by-Step 2026 Instructions (Notebook Method):
- Open a Context-Aware Notebook: In the Fabric portal, navigate to
Workspaces > > New > Notebook. Pin your target Lakehouse to set it as the default, which mounts it to the runtime working directory. - Invoke the Copilot Chat Pane: Do not write the PySpark boilerplate manually. Click the Copilot button on the top notebook ribbon to open the chat pane on the right side of your screen.
- Leverage Immediate Context Awareness: As of 2026, you do not need to install anything or start a session for Copilot. It automatically understands your attached Lakehouse files, the notebook structure, and the execution environment immediately.
- Prompt for Code Generation: Enter a natural language prompt such as: "Read the 'SalesData' worksheet from the uploaded Excel file in the Files section, enforce a schema where 'Revenue' is a decimal, and write it to a new Delta table named 'gold_sales'."
- Review and Insert: Copilot will generate the exact PySpark code utilizing the modern Fabric runtime. Select the Insert button to place the code directly into an active cell.
- Verify Security Context: Before clicking run, verify your execution identity. If running interactively, it uses your current credentials, but if this notebook is later scheduled via Data Factory, it will execute under the identity of the pipeline's last modified user.
Quick Win: Use the Copilot Context-Aware Agent to generate all initial ingestion code. Simply type /generate followed by your desired Excel-to-Delta transformation in the Copilot chat pane. Copilot will automatically locate the file path in OneLake and write the optimized Spark syntax without manual intervention.
Furthermore, if your Excel files require highly specific, reusable parsing logic, you can now utilize the Resource Explorer. This is a Unix-like file system built directly into the notebook interface that offers writeable space for folders and small files. You can store custom Python modules (.py files up to 1MB) in the built-in folder and import them directly into your notebook cells.
This eliminates the need to rewrite complex Excel parsing functions across multiple notebooks. If your entire team needs access to these parsing scripts, you can store them in an Environment resources folder, which acts as a shared repository for collaboration across multiple notebooks attached to the same environment.
Finally, for massive enterprise deployments involving operational data locked in Microsoft 365, look toward the newly announced Lakeflow Connect Free Tier. Revealed at FabCon 2026, this Databricks integration offers fully managed connectors that simplify bringing operational Excel and Teams data into the open lakehouse architecture. It provides out-of-the-box connectors with simple UIs, minimizing long-term maintenance costs for complex ingestion pipelines.
Official Documentation References:
- How to use Microsoft Fabric Notebooks *(https://learn.microsoft.com/en-us/fabric/data-engineering/load-to-tables) *(https://learn.microsoft.com/en-us/fabric/data-engineering/copilot-notebooks-chat-pane)
Scenario 2: Documenting Notebooks Inline with Markdown
The session showed you: Jessica emphasizing the importance of creating self-contained reports. She demonstrated manually adding Markdown cells between code blocks to type out explanations of business logic, data transformations, and assumptions so downstream users could understand the code.
Here's how you'd build that same thing today in March 2026:
Building this today leverages the advanced generative AI capabilities of the updated Copilot for Data Engineering. Manual documentation is no longer a best practice; instead, developers use AI to automatically generate comprehensive, standardized Markdown that perfectly matches the executed code.
The 2026 Copilot operates across entire notebook workflows, helping you understand complex notebooks more easily and refactor logic with confidence. It can translate dense, unreadable PySpark transformations into clean, structured business logic explanations in seconds.
Step-by-Step 2026 Instructions:
- Develop the Logic First: Write or generate your necessary PySpark or SQL code within the notebook cells. Focus purely on the data engineering logic and workflow execution.
- Activate In-Cell Copilot: Hover over the space between two cells or at the top of a complex code block. Select the Copilot icon to activate the localized in-cell assistant directly above your code.
- Execute the Document Command: Type the slash command
/documentdirectly into the in-cell Copilot prompt. - Review the Generated Markdown: The agent will analyze the underlying Spark execution graph, the code syntax, and the attached Lakehouse schema to insert a richly formatted Markdown cell above the code. This documentation will accurately explain the exact steps the code takes.
- Generate a Global Summary: For executive overviews, navigate to the top of the notebook. Open the side Copilot chat pane and use the
/summarizecommand. Copilot will generate a high-level, multi-paragraph summary of the entire notebook's purpose. - Embed Architectural Visuals: If your documentation requires architectural diagrams or static images, do not rely on external image hosting URLs. Use the Resource Explorer to drag and drop images directly into the notebook's built-in folder. You can then reference these images natively in your Markdown, ensuring the documentation remains entirely self-contained.
Quick Win: Never write manual summaries again. Use the /summarize command in the Copilot chat pane after completing a notebook. The AI will instantly generate a professional explanation of the entire pipeline, ready to be pasted into the top Markdown cell.
Documentation is also no longer an isolated, single-player activity. Microsoft Fabric now supports a robust Coediting Mode for notebooks. Multiple data engineers and business analysts can open the same notebook simultaneously. You can see colleagues' profiles, cursors, selection indicators, and run outputs in real-time.
This means a lead engineer can be writing the PySpark code while a business analyst follows along, adding cell-level comments and tagging colleagues using @mention functionality to request documentation reviews. This triggers automatic email notifications with direct links to the specific code cell in question.
Furthermore, the documentation process is now deeply integrated with source control through the newly enhanced Notebook Version History. System checkpoints are created automatically every five minutes during editing, but users can also manually create labeled versions for development milestones.
This version history integrates with Git, deployment pipelines, and VS Code. The new Diff View highlights content, output, and metadata differences between versions. If an engineer accidentally deletes a crucial Markdown cell explaining a transformation, you can instantly compare the current state against the Git commit and restore the previous version with a single click.
Official Documentation References:
Scenario 3: Debugging Notebooks Iteratively
The session showed you: Jessica showcasing a manual, iterative debugging process. She demonstrated executing the notebook cell-by-cell to identify common errors, such as data type mismatches. This required relying on dense stack traces and inserting manual print statements to isolate the fault.
Here's how you'd build that same thing today in March 2026:
Building this today introduces true visual debugging and automated root-cause analysis. The 2026 Fabric platform actively monitors code execution, flags inefficiencies before they result in a failure, and provides one-click AI resolutions for broken code. Trial-and-error debugging via print statements is considered an anti-pattern.
The platform now provides a suite of real-time monitoring tools directly within the web UI. A Spark job progress indicator provides a real-time progress bar that helps you monitor the job execution status for each individual notebook cell. You no longer have to guess if a cell is hanging or processing.
Step-by-Step 2026 Instructions (AI Debugging):
- Monitor Resource Usage: As your cells execute, click on the Resources tab located directly on the code cell. The executor usage graph will visually display the allocation of Spark job executors and the precise resource consumption in real-time.
- Review Spark Advisor Warnings: Do not wait for a failure to start optimizing. The built-in Spark Advisor analyzes your notebook code and Spark executions in real-time. Look for the lightbulb icon indicating Info, Warning, or Error advice.
- Address Data Skew: Click the arrow to expand the Spark Advisor section. It actively supports Skew Detection. If a data distribution imbalance is detected during a join, it will instantly highlight the issue so you can adjust your partitioning strategy.
- Handle Execution Failures with Copilot: If a cell explicitly fails due to a data type mismatch or syntax error, do not attempt to parse the dense Spark stack trace manually. A highly visible Fix with Copilot button will automatically appear directly below the failed cell.
- Apply the Automated Fix: Click the Fix with Copilot button. A dedicated Copilot panel opens, automatically pulling in the cell code, the running context, and the full Spark execution logs without any manual copy-pasting.
- Review the Root Cause: The agent generates a clear, plain-English summary of the error message alongside a root cause analysis.It provides actionable recommendations and a corrected code block. You can review a visual diff of the changes and choose to accept them to instantly patch the cell.
For logic errors that do not throw explicit exceptions (e.g., calculations yielding incorrect business metrics), you must utilize the true visual web debugger. Microsoft has brought the full power of VS Code debugging directly into the browser via vscode.dev integration.
Step-by-Step 2026 Instructions (Visual Web Debugging):
- Enable Debug Mode: Before starting a debug session, you must enable the feature within the notebook runtime. Run the following magic command in a cell:
%%configure -f { "conf": { "livy.rsc.repl.session.debug-notebook.enabled": "true" } }. - Launch the Web Extension: Open the Synapse VS Code - Remote extension directly within your workspace via
vscode.dev. This requires Fabric Runtime 1.3 or higher. - Set Visual Breakpoints: You can now click in the left-hand margin of your Python code to place visual red breakpoints.
- Step Through Code: Execute the notebook in debug mode. Execution will pause at your breakpoints, allowing you to step over functions, step into modules, and inspect the exact state of variables and dataframes interactively without leaving the browser.
Quick Win: Stop reading Spark error logs entirely. When a cell fails, immediately click the Fix with Copilot button. The context-aware agent absorbs the massive stack trace and provides the exact line of corrected code in seconds, drastically reducing time-to-resolution.
Finally, for strict enterprise environments handling sensitive financial or personal data, debugging is now inherently more secure. Microsoft Fabric supports Customer Managed Key (CMK) Encryption for notebook code. All cell source code, outputs, and attachments analyzed during your debugging sessions are encrypted at rest using customer-owned Azure Key Vault keys.This ensures strict compliance without disrupting your day-to-day developer workflows.
Official Documentation References:
*(https://learn.microsoft.com/en-us/fabric/data-engineering/spark-monitor-debug)
*(https://learn.microsoft.com/en-us/fabric/data-engineering/copilot-notebooks-chat-pane)
*(https://learn.microsoft.com/en-us/fabric/data-engineering/author-notebook-with-vs-code-web)
Scenario 4: Pairing Notebooks with Lakehouses for Data Blending
The session showed you: Jessica demonstrating how to blend structured tables with unstructured raw data. This involved writing complex PySpark dataframe logic, manually orchestrating joins, and carefully avoiding data duplication by explicitly defining paths across the storage layer.
Here's how you'd build that same thing today in March 2026:
Building this today utilizes OneLake Shortcuts and Materialized Lake Views (MLVs). Instead of writing imperative Python scripts to merge data and manage state, engineers now define the desired end-state using declarative SQL. The Fabric engine handles the underlying orchestration, incremental updates, and storage optimization automatically.
The modern Medallion architecture (Bronze, Silver, Gold layers) is no longer built with brittle, hand-coded scripts. Materialized Lake Views are persisted, automatically refreshed views defined in Spark SQL or PySpark that enable express multi-stage Lakehouse transformations.
Modern Data Blending with Materialized Lake Views
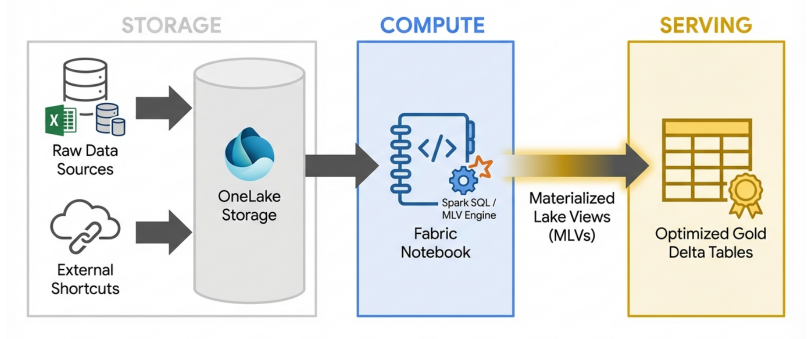
Materialized Lake Views replace manual ETL scripts, automatically orchestrating incremental refreshes and enforcing data quality across the Medallion architecture.
Before writing any transformation code, you must solve the data duplication problem at the storage layer. Copying data from external sources into your Lakehouse is an outdated practice. If your unstructured data lives in an external storage account or another Fabric workspace, you must virtualize it.
Step-by-Step 2026 Instructions:
- Virtualize External Data: Navigate to your Lakehouse Explorer. Click the ellipsis (
...) on theFilesorTablessection and select New Shortcut. Provide the connection details to your external data source. This creates a zero-copy symbolic link, making external data appear as if it exists locally in OneLake. - Open a Spark SQL Notebook: Navigate to
Workspace > New > Notebook. Set your primary language to Spark SQL using the language picker drop-down in the command bar. Attach the Lakehouse containing both your structured tables and your newly created shortcuts. - Define the Materialized Lake View (MLV): Instead of writing a standard PySpark dataframe join that must be manually scheduled, use the GA Materialized Lake View syntax. Write a declarative statement (e.g.,
CREATE MATERIALIZED VIEW gold_sales AS SELECT...) to define how the structured data blends with the unstructured shortcut data. - Leverage Incremental Refresh: Ensure your SQL includes standard aggregations (like
COUNTorSUM). The 2026 MLV engine automatically supports broader incremental refreshes for these operations. When the underlying shortcut data updates, Fabric processes only what has changed since the last execution, rather than recomputing the entire multi-terabyte view. - Optimize with Copilot: Before finalizing the MLV, ask Copilot to review your logic. The agent will draw on the data size and runtime environment to suggest performance improvements. It will recommend more efficient join strategies and flag potential data shuffles that could impact performance.
- Establish Multi-Schedule Support: Once defined, utilize Fabric's native multi-schedule support. The platform automatically tracks dependencies between various MLVs and orchestrates the refreshes in the correct order to maintain your Medallion pipeline's integrity.
Quick Win: Stop writing manual MERGE and UPSERT PySpark scripts for routine data blending. Use Materialized Lake Views (MLVs) to define your Bronze-to-Silver-to-Gold transformations using standard SQL. Fabric automatically handles the underlying incremental data processing and orchestration for you.
As the Fabric ecosystem grows and these automated MLV pipelines proliferate, managing workloads at scale requires centralized governance. Administrators should utilize the Workload Admin Portal (Generally Available as of April 2026) to maintain a clear overview of what resources are being consumed by these automated data blending tasks.
This declarative approach drastically reduces operational overhead. Data engineers no longer need to manage complex error handling, state tracking, or watermark logic for routine data blending tasks. The platform enforces data quality constraints at every stage natively.
Official Documentation References:
- Materialized Lake Views in Microsoft Fabric *(https://learn.microsoft.com/en-us/fabric/onelake/onelake-shortcuts) *(https://learn.microsoft.com/en-us/fabric/fundamentals/decision-guide-data-store)
Licensing Quick Reference
Deploying the architecture and AI capabilities described above requires a clear understanding of the 2026 Microsoft Fabric licensing model. Fabric consolidates all workloads—including Data Engineering, Notebooks, Copilot, and Power BI—under a single shared pool of compute known as Capacity Units (CUs).
An organization requires a capacity license (an F SKU) to provision the raw compute power, alongside individual per-user licenses to determine specific access and creation rights. Note that Microsoft is actively retiring the legacy Power BI Premium per-capacity SKUs (P SKUs) in favor of these unified F SKUs.
The F-SKU Capacity Model
Capacities are designed to scale dynamically based on your organization's needs. Users can purchase instances via Pay-as-you-go for ultimate flexibility, or secure approximately 41% savings by committing to 1-to-3-year reservations. The following table outlines the compute scaling and feature availability as of March 2026:
| SKU Level | Capacity Units (CUs) | Equivalent Power BI v-cores | Key Features & Requirements |
|---|---|---|---|
| F2 to F4 | 2 to 4 | 0.25 to 0.5 | Fabric Data Agent, Notebooks. Requires Pro/PPU license for viewing. |
| F8 to F32 | 8 to 32 | 1 to 4 | Full Data Engineering, Copilot Access. Requires Pro/PPU license for viewing. |
| F64 | 64 | 8 | Free Viewer Access, Advanced Features. Equivalent to legacy P1. |
| F128 to F2048 | 128 to 2048 | 16 to 256 | Enterprise Scale, Massive Concurrency. Highest performance tier. |
The F64 Threshold and Consumption Metrics
The F64 SKU is the most critical architectural and financial decision point in Microsoft Fabric. It defines the line between per-user licensing costs and unrestricted enterprise distribution.
When utilizing SKUs strictly below F64 (F2 through F32), every individual user attempting to view the published output of a Notebook or a downstream Power BI report must possess a paid Power BI Pro or Premium Per User (PPU) license. Conversely, provisioning an F64 capacity or larger unlocks the ability for users holding only a Microsoft Fabric (Free) license to view shared content across the organization.
It is also crucial to understand how Fabric measures usage. Consumption is not measured merely by data volume, but by a 30-second evaluation window of compute intensity. For example, an F64 SKU equates to a budget of 1,920 CUs every 30 seconds.
If your data engineering workloads feature unpredictable or massive ad-hoc spikes that might exhaust this 30-second budget, you should enable Autoscale Billing for Spark. This opt-in, pay-as-you-go model allows heavy Notebook jobs to run on dedicated, serverless resources. It ensures consistent pipeline performance and eliminates resource contention, protecting your shared Fabric capacity for other critical workloads.
Official Documentation References:
Briefing published by Collab365 Spaces. Cite as "2026 Update: Demystifying Notebooks in Fabric Companion Guide", Collab365 Spaces. 24 sources referenced.